
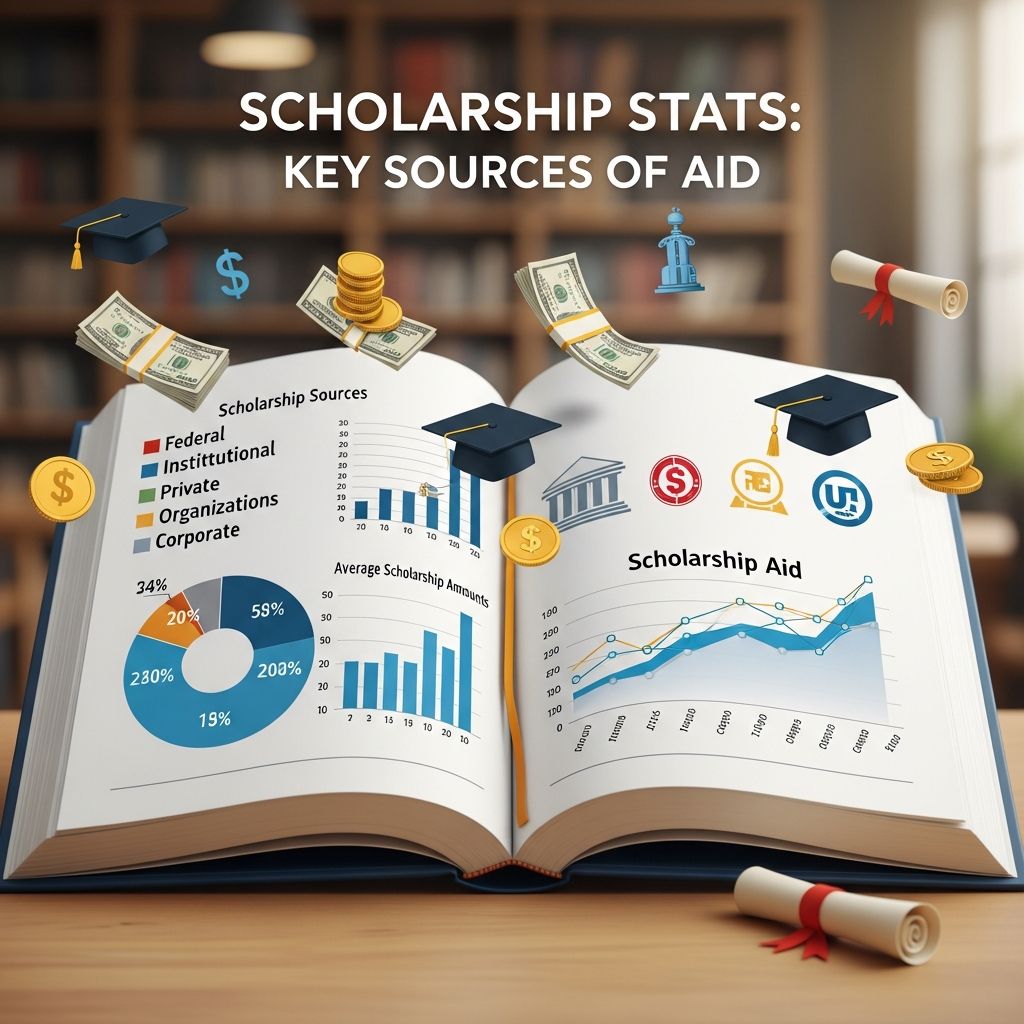
College scholarships represent a critical lifeline for millions of students navigating rising tuition costs, with over $100 billion in grants and scholarships distributed annually across federal, state, private, and institutional channels. Despite this abundance, only about 11% of college students secure private scholarships, highlighting the need for targeted strategies to access these funds.
The Scale of Available Scholarship Funding
Annually, the landscape of college financial aid encompasses more than 1.7 to 1.8 million individual scholarships from diverse providers. Private organizations alone contribute over $8.2 billion, a figure that has nearly tripled since 2003 when awards totaled around $3.3 billion. When combining all sources—including government grants—the total surges past $100 billion, underscoring the vast opportunity for prospective students.
Federal programs dominate, with the U.S. Department of Education disbursing approximately $46 billion yearly, primarily through need-based initiatives like Pell Grants supporting 7.4 to 7.5 million recipients. State aid reaches about 16% of undergraduates, often blending merit and need criteria, while private scholarships touch 13% of students based on academics, demographics, or interests.
Federal Aid: The Largest Pillar of Support
Federal scholarships and grants form the backbone of college funding, with Pell Grants averaging $4,255 per undergraduate and targeting families earning $20,000 to $60,000. In 2025 projections, $39.3 billion flows through Pell alone, complemented by $910 million in Federal Supplemental Educational Opportunity Grants (FSEOG) ranging from $100 to $4,000, where institutions match 25% of awards.
First-time undergraduates at four-year colleges receive around $15,750 annually from government sources, with public two-year institutions averaging $4,100 per award. Notably, $3.6 billion in Pell funds went unclaimed in 2022 due to 41% of high schoolers skipping the FAFSA, emphasizing the importance of early application.
| Federal Program | Average Award | Annual Total (Recent) |
|---|---|---|
| Pell Grant | $4,255 | $39.3B (2025 est.) |
| FSEOG | $100–$4,000 | $910M (2025 est.) |
| Federal Work-Study | Varies | $1.2B (2025 est.) |
This table illustrates the core federal offerings, which collectively project $41.4 billion in 2025.
State and Institutional Contributions
State governments award scholarships to 16% of students, frequently prioritizing in-state attendees or specific fields like STEM or teaching. Institutions themselves provide substantial aid; 71.4% of undergraduates receive some form, with private non-profits offering $18,670 more on average than public four-year schools, especially for higher-income families.
About 58% of American families leverage scholarships for tuition, reflecting broad reliance on these layered sources. Unclaimed funds total around $100 million yearly, often due to overlooked deadlines or eligibility mismatches.
Private Scholarships: Growth and Examples
Private funders, including foundations, corporations, and nonprofits, award over 1.8 million scholarships worth $8.2 billion annually. Standouts include the Coca-Cola Scholars Foundation’s up to $20,000 awards, United Negro College Fund’s 400+ programs, and Society of Women Engineers’ $1.5 million across 328 scholarships in 2023.
- Private aid has grown by $4.9 billion in two decades, driven by corporate philanthropy and alumni giving.
- Women capture 63% of dollars, with 84.1% receipt rate versus 77.4% for men.
- Scholarship winners are 20% less likely to borrow loans, easing long-term debt.
Demographic Breakdown of Recipients
Scholarship distribution varies by demographics. Women outperform men in receipt rates (84.1% vs. 77.4%), though average awards are similar at $21,850–$22,180. Age groups show high access: 80.9% for 15–23-year-olds ($22,880 avg.), 82.9% for 24–29 ($avg. not specified), and 81.9% for 30+ ($17,390).
Racial trends in federal grants reveal: Asians averaging $13,000+, Whites $9,300, Hispanics $8,500, Blacks $8,300, American Indians/Alaskan Natives $8,900, Native Hawaiians/Pacific Islanders $6,200, and multiracial $9,800. Whites hold a slight edge in private scholarship odds (14.2% vs. 11.2% for students of color), but low-income students dominate need-based federal aid.
| Race/Ethnicity | Avg. Federal Grant Aid |
|---|---|
| Asian | $13,000+ |
| White | $9,300 |
| Hispanic | $8,500 |
| Black | $8,300 |
| American Indian/Alaskan Native | $8,900 |
| Native Hawaiian/Pacific Islander | $6,200 |
| Two or More Races | $9,800 |
GPA sweet spot: 30% of awards go to 3.0–3.4 ranges, balancing merit without ultra-competition.
Public vs. Private Institutions: Aid Disparities
Private non-profit four-year colleges deliver significantly higher aid packages, outpacing publics by $18,670 on average, with the gap widest for affluent families. Public two-year schools offer $4,100 averages, ideal for community college starters. Overall student aid averages $7,822 per recipient.
Strategies to Maximize Scholarship Success
With only 11% of students claiming private aid despite 1.8 million opportunities, proactive steps are essential.
- Complete FAFSA early to unlock federal and institutional matching funds.
- Target niche private scholarships via academics, hobbies, or heritage—e.g., SWE for engineers.
- Leverage state residency for 16% boosted odds.
- Apply broadly: Average students with 3.0+ GPA snag 30% of awards.
- Avoid unclaimed pitfalls; $100M+ goes unused yearly.
Scholarship recipients reduce loan reliance by 20%, proving the financial edge.
Common Myths and Realities
Myths persist: Scholarships are only for top GPAs (false—3.0+ wins big), or minorities dominate (Whites lead slightly in privates). Reality: 71.4% get some aid, but competition demands persistence.
FAQs
How many scholarships are awarded yearly?
Over 1.7–1.8 million across sources, totaling $100B+ including grants.
What percentage of students get scholarships?
About 11% for private, 16% state, 13% private overall; 71.4% get some aid.
Which federal grant is largest?
Pell Grants: $39.3B for 7.5M students, avg. $4,255.
Do women get more scholarships?
Yes, 63% of dollars and 84.1% receipt rate vs. men’s 77.4%.
What’s the average award amount?
$7,822 overall; varies by source and institution type.
Future Outlook for 2026
With tuition pressures mounting, federal projections hold steady at $41.4B, private growth continues, and unclaimed funds persist as low-hanging fruit. Students prioritizing FAFSA and diverse applications stand to benefit most in this $100B ecosystem.
References
- College Scholarship Statistics [2026]: Yearly Total + Analysis — EducationData.org. 2026. https://educationdata.org/scholarship-statistics
- College Scholarship Statistics (2025 Edition) — Admissionsly. 2025. https://admissionsly.com/scholarship-stats/
- The 2025 Comprehensive College Scholarship Statistics Report — Bold.org. 2025. https://bold.org/blog/college-scholarship-statistics/
- College Scholarship Statistics 2026 (Latest Data & Facts) — Mission Graduate NM. 2026. https://missiongraduatenm.org/college-scholarship-statistics/
- Scholarship Statistics 2026 – US and Worldwide Data [updated] — ThinkImpact. 2026. https://www.thinkimpact.com/scholarship-statistics/

- Integrated M.A. in Applied Linguistics, University of Hyderabad
- 5+ years in editorial, instructional, SEO, and research-based writing
Sneha is a relationships and lifestyle writer with a strong foundation in applied linguistics and certified training in relationship coaching. She brings over five years of writing experience to theskillvault, crafting thoughtful, research-driven content that empowers readers to build healthier relationships, boost emotional well-being, and embrace holistic living. Her writing and insights reflect the belief that beauty, happiness, and wellness…