
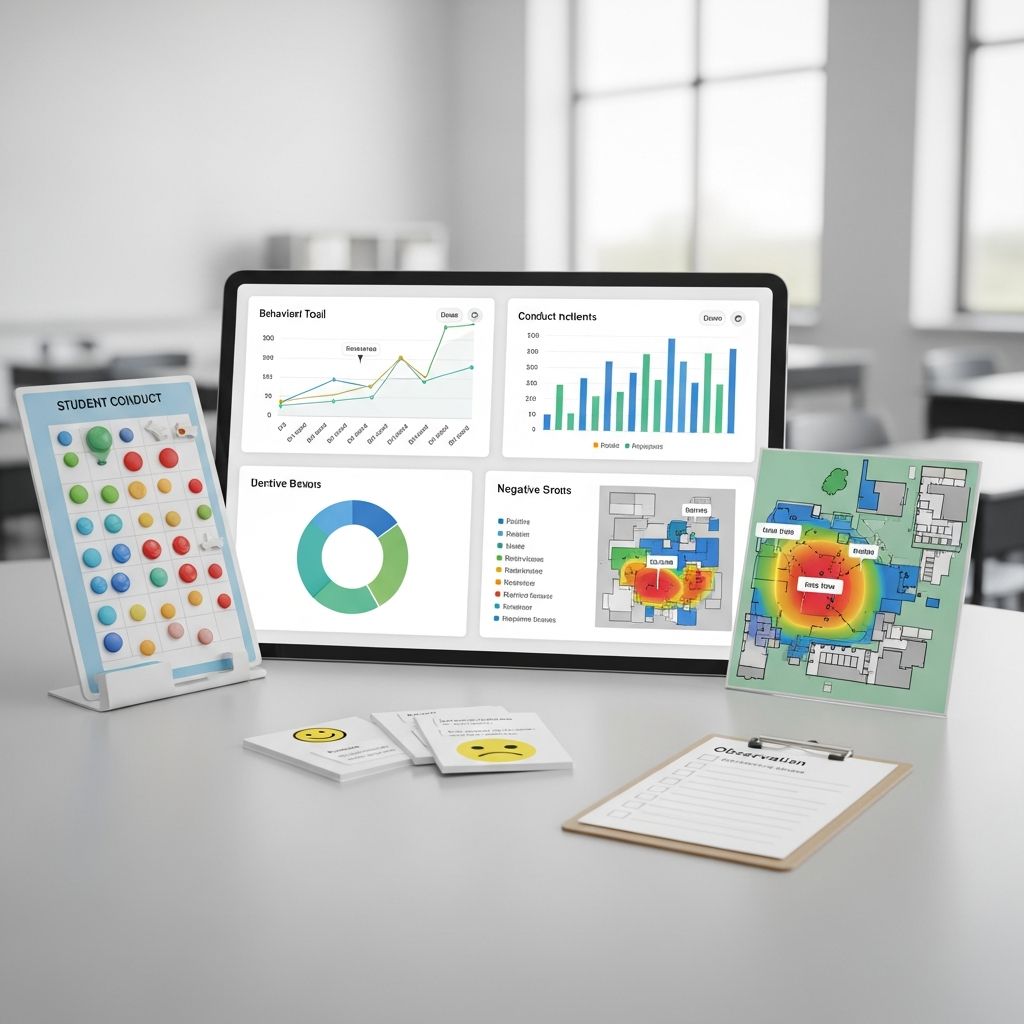
Effective classroom management hinges on clear observation and systematic recording of student behaviors. Graphic organizers serve as powerful visual aids that simplify this process, allowing educators to capture patterns, encourage self-reflection, and implement targeted interventions. These tools go beyond traditional checklists by presenting information in structured, intuitive formats that engage both teachers and students.
Why Visual Documentation Matters in Modern Classrooms
Today’s diverse classrooms demand flexible strategies to address varying behavioral needs. Research shows that visual representations help students with learning differences, such as autism spectrum disorder (ASD), process information more effectively by making abstract concepts concrete. For instance, a 2024 meta-analysis in Exceptionality confirmed graphic organizers significantly boost academic and behavioral outcomes for students with disabilities.
Teachers benefit too: these tools reduce subjectivity in assessments and provide data for progress monitoring. Unlike anecdotal notes, visual trackers reveal trends over time, informing decisions on positive reinforcement or skill-building activities. In inclusive settings, they support students with significant cognitive disabilities by breaking down complex social expectations into digestible parts.
Essential Types of Behavior-Focused Graphic Organizers
A wide array of graphic organizers can be adapted for behavior tracking. Below, we outline key categories with practical applications, drawing from proven templates used in K-12 environments.
- Reflection Sheets: These prompt students to analyze their actions post-incident. A typical sheet includes sections for ‘What happened?’, ‘My feelings’, ‘Impact on others’, and ‘Better choices next time’. Ideal for restorative practices.
- Expected vs. Unexpected Behavior Quadrants: Divide a page into four parts representing settings like classroom, hallway, playground, and cafeteria. Students note appropriate and inappropriate actions, plus associated thoughts from peers’ perspectives.
- Cause-and-Effect Diagrams (Fishbone): Students identify a behavior problem as the ‘head’ and branch out triggers (e.g., hunger, fatigue) and consequences. This fosters problem-solving skills.
- T-Charts for Choices: Compare pros/cons of behaviors, such as ‘Following directions’ vs. ‘Disrupting class’. Great for decision-making discussions.
- Sequence Charts: Map out behavior timelines, from trigger to resolution, helping students visualize steps to de-escalate.
Implementing Organizers for Daily Behavior Logs
Start with a simple daily log template. Create a table tracking time, behavior observed, antecedents, and teacher response. Over a week, patterns emerge—perhaps disruptions spike post-recess.
| Time | Behavior | Antecedent | Consequence | Intervention |
|---|---|---|---|---|
| 9:00 AM | Off-task talking | Group transition | Verbal reminder | Positive note home |
| 11:30 AM | Refusal to work | Hunger cues | Snack break | Self-monitoring chart |
| 2:00 PM | Positive: Helped peer | Structured praise | Sticker reward | Peer modeling |
Customize for individuals: For a student prone to outbursts, add emotion scales (1-5 smileys). Digital versions via Google Drawings allow real-time updates and sharing with parents.
Advanced Strategies: From Reflection to Goal-Setting
Elevate basic trackers into growth tools. Combine a ‘Think-Aloud Web’ where students cluster thoughts leading to actions, paired with goal-setting hexagons. Each hexagon represents a weekly target, like ‘Raise hand before speaking’, connected to supporting strategies.
In special education, Frayer Models adapt well: Define ‘Respectful behavior’, list characteristics (e.g., listening), examples/non-examples, and illustrations. For group dynamics, use clustering webs to map class-wide issues and collective solutions.
Technology-Enhanced Visual Tracking
Digital tools amplify organizers’ impact. Apps like Popplet enable drag-and-drop mind maps for behavior brainstorming, while Inspiration Maps offers customizable templates with voiceovers for accessibility.
- Canva: Free templates for printable or shareable charts.
- Google Slides: Collaborative timelines for team teaching.
- iPad apps: Story-mapping tools improved comprehension and behavior in ASD case studies.
A study highlighted iPad interventions with visual prompts yielding notable gains in self-regulation. Integrate these with school platforms for seamless data export to IEPs.
Case Studies: Real Classroom Transformations
In one elementary setting, T-Charts reduced disruptions by 40% as students self-assessed choices daily. A middle school adopted fishbone diagrams, uncovering sensory overload as a root cause, leading to quiet zones.
For high schoolers, decision-making models listed behavior options with outcomes, boosting accountability. These examples underscore adaptability across grades.
Training Students and Staff for Success
Direct instruction is key. Model filling an organizer: ‘See how I draw the fishbone? Head is the problem; bones are causes.’ Practice with scenarios, then independent use.
Staff workshops ensure consistency. Share editable templates via shared drives, emphasizing data privacy under FERPA guidelines.
Overcoming Common Challenges
Resistance from older students? Frame as ‘personal dashboards’ for autonomy. Time constraints? Prep reusable laminates with dry-erase markers. For non-readers, use symbols and pictures.
Measure success quantitatively: Track incident frequency pre/post-implementation. Adjust based on feedback loops.
Frequently Asked Questions
What age groups benefit most from behavior graphic organizers?
They’re versatile for K-12, with simpler visuals for younger students and complex analyses for teens.
Can these tools replace formal discipline systems?
No, they complement by providing data for PBIS or RTI frameworks.
Are free digital templates available?
Yes, platforms like Teachers Pay Teachers offer free downloads, and Google tools are built-in.
How do graphic organizers help students with autism?
They concretize social rules, improving comprehension and self-monitoring per research.
What’s the best way to involve parents?
Share digital copies via portals, focusing on progress highlights.
Building a Comprehensive Behavior Toolkit
Assemble a kit with 5-7 core organizers, rotating weekly. Pair with incentives: ‘Fill your reflection sheet, earn choice time.’ Long-term, students internalize habits, reducing teacher workload.
Incorporate KWHL charts for behavior lessons: What I Know about rules, Want to improve, How I’ll learn, What I Learned. This meta-cognitive layer cements growth.
Ultimately, these visual tools democratize behavior management, turning reactive discipline into proactive development. Educators report higher engagement and fewer escalations, creating harmonious learning spaces.
References
- Behavior Graphic Organizer – TPT — Teachers Pay Teachers. 2024. https://www.teacherspayteachers.com/browse/free?search=behavior+graphic+organizer
- Graphic Organizers & Note-Taking Strategies — Techno Babble with TWenter. 2024. https://sites.google.com/view/technobabblewithtwenter/resources/pedagogy/graphic-organizers-note-taking-strategies
- Graphic Organizers for Students with Autism — LeafWing Center. 2024-10-15. https://leafwingcenter.org/graphic-organizers-for-students-autism/
- Graphic Organizers in Inclusive Classrooms — TIES Center, University of Minnesota. 2023. https://publications.ici.umn.edu/ties/foundations-of-inclusion-tips/graphic-organizers-in-inclusive-classrooms-for-students-with-significant-cognitive-disabilities
- Behavior Reflection Sheet Graphic Organizer — Teachers Pay Teachers. 2024. https://www.teacherspayteachers.com/browse?search=behavior+reflection+sheet+graphic+organizer

Medha Deb is an editor with a master's degree in Applied Linguistics from the University of Hyderabad. She believes that her qualification has helped her develop a deep understanding of language and its application in various contexts. Medha specializes in the areas of beauty, health, sports, and wellness and is committed to ensuring that the content on the website is…