
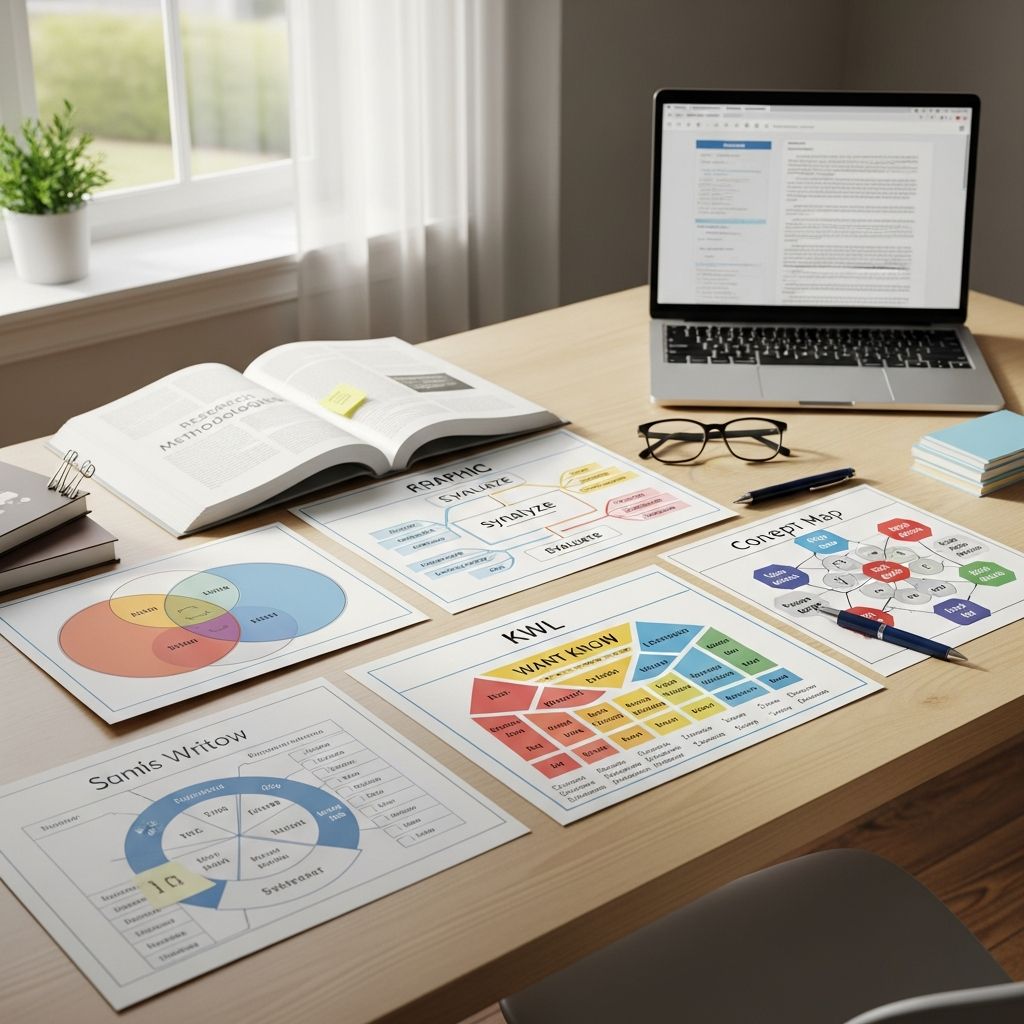
Graphic organizers serve as essential visual tools that help students structure complex information, making the research process more approachable and effective. By breaking down tasks into manageable parts, these aids foster critical thinking and retention across subjects.
Understanding the Power of Visual Tools in Research
Visual representations like diagrams and charts simplify abstract concepts, allowing learners to connect ideas visually. Research shows they reduce cognitive load by providing frameworks for hierarchy, cause-effect relationships, and sequences. In classrooms, they bridge prior knowledge with new content, enhancing comprehension during reading and post-analysis.
Teachers report that integrating these tools leads to better organization of thoughts, especially in inquiry-based learning where students explore topics independently. For instance, they help categorize evidence and reflect on findings, turning vague curiosity into structured investigation.
Key Stages of Research and Matching Organizers
The research journey typically unfolds in phases: sparking interest, gathering data, analyzing findings, and synthesizing results. Each stage benefits from specific organizers tailored to its demands.
- Initial Exploration: Brainstorm questions and activate background knowledge.
- Data Collection: Note sources and key facts reliably.
- Analysis: Identify patterns, causes, and connections.
- Synthesis: Summarize insights and draw conclusions.
Adapting organizers to these phases ensures students progress logically without overwhelm.
Essential Organizers for Sparking Inquiry
Beginning research with observation and questioning sets a strong foundation. Tools like mind maps or question webs encourage free-form idea generation.
A Question Web places a central topic in the middle, with radiating spokes for ‘who, what, when, where, why, and how’ prompts. This visual prompts deeper curiosity and helps verify initial assumptions.
| Organizer Type | Purpose | Best For |
|---|---|---|
| Question Web | Generate targeted questions | Topic introduction |
| Mind Map | Brainstorm associations | Prior knowledge activation |
| KWL Chart | Track known, wanted, learned | Pre-research planning |
These starters make abstract research tangible, boosting engagement from the outset.
Streamlining Information Gathering
Once questions form, students dive into sources. Organizers here focus on credibility and note-taking to avoid misinformation.
The Fact vs. Fiction Grid divides a page into columns for potential facts, supporting evidence, sources, and verification status. It teaches discernment, essential in today’s information landscape. Pair it with a source tracker listing URLs, authors, and dates for building bibliographies early.
- Column 1: Claim or discovery
- Column 2: Evidence found
- Column 3: Source details
- Column 4: Reliable? (Yes/No/Needs More)
This method promotes accountability and prepares students for cited work.
Analyzing Data with Advanced Visuals
Mid-process, synthesis requires spotting relationships. Cause-effect diagrams, like the Fishbone, dissect problems into categories such as people, processes, and materials.
Flowcharts map sequences, ideal for procedural research like scientific methods. They use arrows to link steps, revealing gaps in logic. For comparisons, Venn diagrams overlap circles to highlight similarities and differences between concepts or sources.
In practice, a class studying ecosystems might use a Fishbone to trace pollution causes, fostering analytical depth.
Synthesizing and Reflecting on Findings
Final stages demand summarization and evaluation. Summary wheels centralize main ideas with spokes for details, while reflection journals pair with timelines of research evolution.
A Research Timeline plots milestones: question posed, sources reviewed, key insights gained, and conclusions formed. This reinforces progression and metacognition.
Post-research, SWOT analysis (Strengths, Weaknesses, Opportunities, Threats) evaluates the inquiry itself, encouraging growth in future projects.
Practical Implementation Strategies
Introduce organizers gradually: model usage, provide practice, then apply independently. Differentiate by offering templates in digital tools like Book Creator for customization.
- Demo on board or screen.
- Guided group practice.
- Individual application with feedback.
Embed in lessons across subjects—history timelines, science cycles, literature character maps—for versatility.
Benefits Backed by Evidence
Studies confirm graphic organizers aid memory transfer from short to long-term by chunking information. They support diverse learners, including those with learning challenges, by visual scaffolding.
In inquiry classrooms, they enhance evidence collection and reflection, leading to authentic understanding. Teachers note improved writing from organized pre-planning.
Customizing for Different Grade Levels
Elementary students thrive with simple icons and colors; middle schoolers add complexity like pros/cons tables; high schoolers tackle multi-layered matrices.[10]
For vocabulary in research, POSSUM organizers cover phonology to morphology systematically.
Frequently Asked Questions (FAQs)
What are the best free graphic organizer tools?
Options include printable PDFs from educational sites and apps like Canva or Book Creator for digital versions.[10]
How do graphic organizers help struggling readers?
They activate prior knowledge pre-reading, organize during, and summarize post-reading, easing comprehension.
Can they be used in non-research lessons?
Yes, for note-taking, plotting stories, or classifying concepts in any subject.
What’s the most effective organizer for beginners?
KWL charts build confidence by valuing existing knowledge.
How often should teachers use them?
Integrate before, during, and after lessons for maximum impact on retention.
Overcoming Common Challenges
Some students resist structure; start with familiar formats like T-charts. Time constraints? Use quick sketches over elaborate designs. Digital fatigue? Provide paper alternatives.
Consistent modeling addresses misuse, turning tools into habits.
Future Trends in Classroom Organizers
AI-driven templates personalize visuals, while interactive platforms enable collaboration. Hybrid print-digital approaches will dominate, adapting to diverse needs.
Equipping students with these skills prepares them for lifelong learning in an info-rich world.
References
- 10 best graphic organizers for teachers — Book Creator. 2023-06-10. https://bookcreator.com/2023/06/10-best-graphic-organizers-for-teachers/
- Research-Based Practice: Graphic Organizers — Winthrop University. N/A. https://www.winthrop.edu/uploadedFiles/ceshs/rex/core-documents/online-module/graphic-organizers.pdf
- Research Graphic Organizer — Teachers Pay Teachers. N/A. https://www.teacherspayteachers.com/browse?search=research+graphic+organizer
- Facilitating Learning With a Graphic Organizer Instructional Strategy — Learning Focused. N/A. https://learningfocused.com/blogs/lesson-planning/graphic-organizer-instructional-strategy
- Graphic Organizers and Research Skills in the Inquiry Classroom — The Art of Inquiry. N/A. https://www.theartofinquiry.ca/post/graphic-organizers-and-research-skills-in-the-inquiry-classroom
- Graphic Organizers — The Teacher Toolkit. N/A. https://www.theteachertoolkit.com/index.php/tool/graphic-organizers
- Graphic Organizers — Iowa Reading Research Center, University of Iowa. N/A. https://irrc.education.uiowa.edu/resources/irrc-resources/reading-graphic-organizers

Medha Deb is an editor with a master's degree in Applied Linguistics from the University of Hyderabad. She believes that her qualification has helped her develop a deep understanding of language and its application in various contexts. Medha specializes in the areas of beauty, health, sports, and wellness and is committed to ensuring that the content on the website is…