
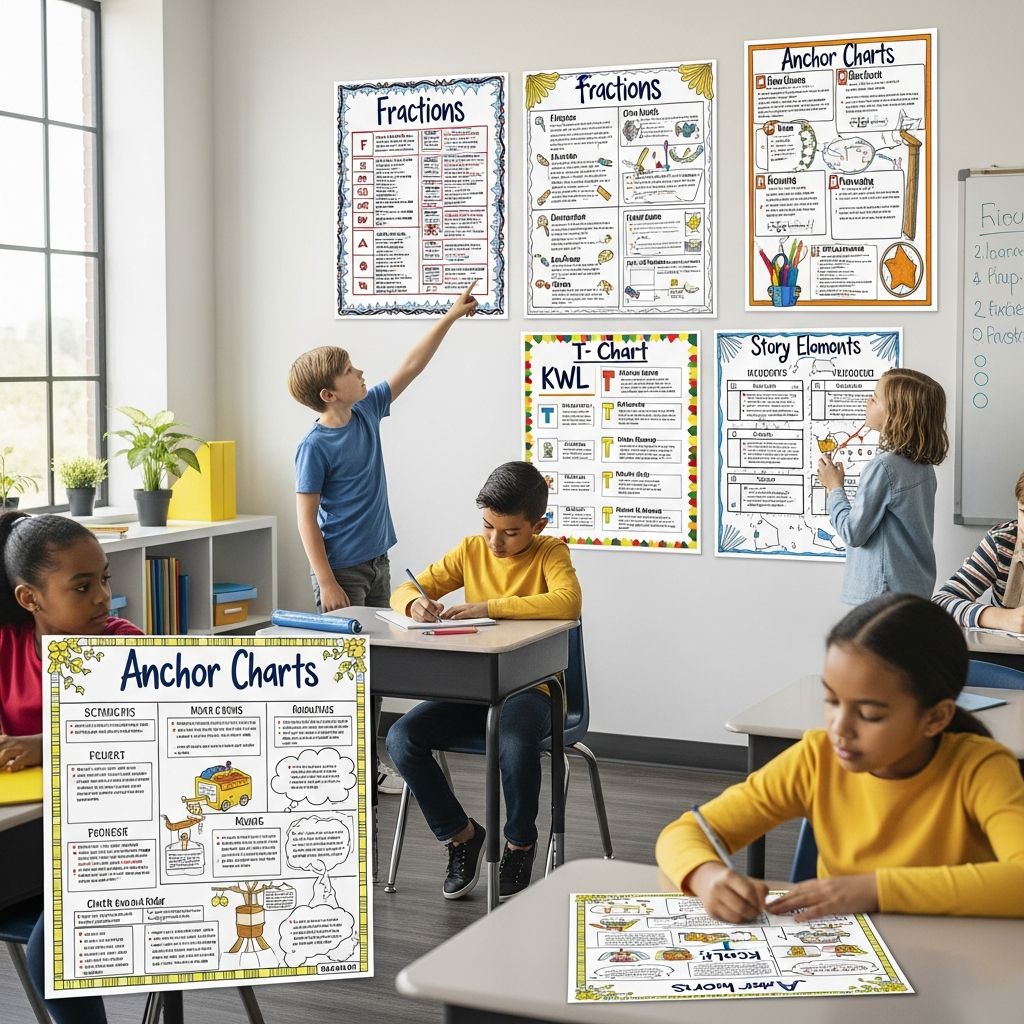
Understanding Anchor Charts as Foundational Teaching Instruments
In contemporary educational settings, teachers constantly seek innovative methods to present complex information in accessible ways. One such method that has gained considerable traction across grade levels and subject areas is the anchor chart—a collaborative visual reference tool designed to support student learning throughout the academic year. These charts transcend traditional poster displays; they represent a dynamic instructional strategy that combines visual representation, student engagement, and independent learning support into one cohesive classroom resource.
An anchor chart functions as a permanent classroom fixture that captures critical content, procedural steps, strategic approaches, and vocabulary in a format students can reference independently. Unlike static decorative posters, effective anchor charts emerge from collaborative construction between teachers and learners, creating shared ownership of the learning process. This distinction is fundamental to understanding why anchor charts have become indispensable in classrooms worldwide.
The Core Components of Effective Anchor Chart Design
Creating anchor charts that genuinely support student learning requires attention to specific design principles. The most impactful charts share common characteristics that distinguish them from less effective visual aids.
Collaborative Construction Process
The foundation of an effective anchor chart lies in its creation method. Rather than teachers preparing charts in advance and posting them as finished products, modern best practices emphasize co-construction with students. This approach transforms the chart-making process into a learning experience itself. Teachers gather students as a learning community, facilitate discussions about key concepts, and record student observations and ideas in real time. This methodology ensures that students witness the thinking process behind the chart’s content, rather than simply encountering a completed product.
Simplicity and Visual Clarity
Anchor charts must communicate information without overwhelming users. Effective charts balance written content with visual elements, using clear labeling, organized layouts, and purposeful illustrations. Teachers should resist the urge to include excessive information; instead, charts should highlight the most essential concepts and strategies students need to reference repeatedly. This principle of minimalism ensures that students can quickly locate and understand the information they need during independent work periods.
Functional Utility
A chart’s educational value hinges on its usability as a reference tool. Students must be able to consult anchor charts independently and gain meaningful support. This means positioning charts strategically throughout the classroom, training students to use charts as problem-solving resources, and consistently directing students to relevant charts when questions arise during instruction or independent practice.
Categorizing Anchor Charts by Purpose and Application
Anchor charts serve multiple instructional functions, and understanding these distinct purposes helps teachers design appropriate charts for their specific classroom needs.
Procedural and Routine Charts
These charts establish and reinforce classroom expectations, routines, and procedures. Examples include charts outlining steps for transitioning between activities, procedures for using classroom materials, expectations for group work, or protocols for independent reading time. Procedural anchor charts are particularly valuable during the beginning of the school year when establishing classroom culture and community norms. When students co-create these charts by contributing ideas about how they want to behave and work together, they develop greater accountability for following the procedures and stronger investment in classroom success.
Strategy and Process Charts
These charts capture step-by-step processes or strategies that students apply across multiple lessons and contexts. They might demonstrate how to approach a mathematical problem, stages in the writing process, strategies for comprehension in reading, steps for conducting a science experiment, or techniques for creating visual art. Strategy charts serve as external memory aids that free students from attempting to recall multi-step processes independently. By displaying worked examples alongside procedural steps, students gain both conceptual understanding and practical guidance.
Vocabulary and Academic Language Charts
Language development constitutes a critical component of academic success, particularly for English language learners and students building content-specific vocabulary. Vocabulary anchor charts present key terms with visual representations, definitions in student-friendly language, and often contextual examples. These charts support vocabulary retention by providing repeated visual encounters with important terms, helping students internalize academic language through multiple exposures in varied contexts.
Strategic Placement and Accessibility Considerations
The physical location of anchor charts significantly impacts their utility. Teachers should position charts near the materials or contexts where students will apply the information. For instance, a chart explaining collage techniques belongs near collage supplies, painting strategy charts near the art sink, or mathematics process charts near the area where students work on math problems. When charts are positioned logically, students naturally encounter them during relevant activities, increasing the likelihood they will reference and internalize the information.
Teachers unable to organize classrooms into distinct work centers can still maximize chart accessibility by grouping all anchor charts in a designated reference area or posting charts on whiteboard edges, cabinet doors, and walls at various points throughout the room. The key is ensuring students can quickly locate needed information without consuming valuable instructional or practice time.
Supporting Student Independence Through Visual Scaffolding
One of the most significant advantages of anchor charts is their capacity to support independent student work. Many students struggle during independent practice periods, either lacking sufficient understanding of content or failing to maintain focus without direct teacher guidance. Anchor charts provide the visual scaffolding these students need to persist through challenges and complete tasks with confidence.
When students encounter difficulties during independent work, they can consult relevant anchor charts to refresh their understanding, recall procedural steps, or identify strategies they may have forgotten. This built-in support system reduces student anxiety, minimizes off-task behavior, and decreases the number of routine questions teachers must answer individually. Over time, as students develop the habit of consulting anchor charts, their problem-solving skills strengthen, and they develop greater academic independence.
Anchor charts also facilitate structured review and assessment opportunities. Teachers can have students create individual anchor charts by filling in organizational worksheets with new material, either throughout a lesson or as a culminating review activity. This active engagement with material allows teachers to evaluate student comprehension while creating personalized reference tools students can retain.
Implementation Framework: Creating Effective Anchor Charts
While anchor chart creation appears straightforward, following a structured approach yields better results. This framework guides teachers through the development process:
- Define Clear Purpose: Establish exactly what skill, procedure, or vocabulary the chart will address. This clarity guides both the construction process and student understanding of how to use the chart.
- Prepare Basic Framework: Develop a simple outline or basic structure ahead of time if helpful, such as boxes for sequential steps or visual organizers for complex concepts. However, remain flexible to accommodate student input.
- Craft Descriptive Title: Create a title that explicitly names the chart’s purpose, making it immediately obvious to students what information they will find. Titles might read “Steps for Independent Reading,” “Strategies for Multiplication,” or “Character Analysis Framework.”
- Facilitate Co-Construction: Gather students and facilitate discussion about the topic. Prompt student thinking with guiding questions, record their ideas and language directly on the chart, and encourage peer contributions and discussion.
- Incorporate Visual Elements: Add illustrations, icons, color-coding, or other visual features that enhance comprehension and make the chart visually engaging and memorable.
- Display Prominently: Post the completed chart where students can easily access it, ideally in a location connected to where they will apply the information.
- Train Reference Skills: Explicitly teach students how to use the chart, demonstrating how to locate information quickly and apply it to their work. Consistently direct students to charts when they ask questions or need guidance.
Differentiated Benefits Across Grade Levels
While anchor charts support learners across all grade levels, specific benefits emerge at different developmental stages. Primary-grade students benefit from charts with strong visual components and simplified text, supporting emergent readers while reinforcing foundational skills. Upper-elementary students can engage in more complex chart construction and reference more detailed procedural and strategy charts. Middle and high school students utilize anchor charts to organize increasingly sophisticated content, support academic vocabulary development, and systematize complex multi-step processes and strategies.
Regardless of grade level, the collaborative construction process remains valuable, as students develop a sense of ownership and investment in their learning when they contribute to resource creation.
Fostering Academic Language Development
Anchor charts function as powerful tools for supporting academic language across all subjects and learner populations. The process of co-creating charts exposes students to subject-specific vocabulary in context, and the persistent visual presence of charts reinforces vocabulary retention through repeated exposure. When teachers encourage students to use precise academic language during chart construction and consistently refer to charts using formal academic vocabulary, students internalize both the language and the concepts it represents.
Building Classroom Community and Shared Ownership
Beyond their instructional functions, anchor charts contribute to classroom culture by fostering shared ownership of learning. When students participate in chart construction, they signal that their ideas matter and that the classroom represents a collaborative learning community. Beginning the year with charts like a Class Agreement—co-created and signed by all students—establishes this culture of co-ownership from the start. Students who participate in developing classroom standards and expectations demonstrate greater accountability for following those standards and stronger investment in maintaining positive classroom relationships.
Frequently Asked Questions
What distinguishes an anchor chart from a regular poster?
The primary distinction lies in the creation process and intended use. Anchor charts are co-created with students during instruction and function as active reference tools students consult repeatedly. Regular posters are typically pre-created by teachers and primarily serve decorative or supplemental purposes. Additionally, anchor charts capture the thinking process around specific skills or procedures, whereas posters may communicate more general information or inspiration.
How long should an anchor chart remain posted in the classroom?
Anchor charts should remain displayed as long as students continue applying the skills or information they represent. Some charts remain visible throughout the entire school year or even across multiple years if they address foundational skills. Other charts may be used intensively for a unit or term, then replaced with new charts addressing different content. Teachers should periodically assess whether charts remain relevant and actively used before deciding to replace them.
Can anchor charts be created digitally or must they be paper-based?
While traditional paper anchor charts offer certain advantages—particularly the tactile, collaborative creation experience—teachers can adapt anchor charts to digital formats when appropriate. Digital versions can be projected, shared with students electronically, or posted in online learning environments. However, the co-creation element remains most powerful when students physically participate in chart development, whether through traditional poster paper or interactive digital tools that allow multiple contributors.
How do teachers prevent anchor charts from becoming cluttered or overwhelming?
Effective anchor charts prioritize simplicity and clarity. Teachers should resist the temptation to include every possible detail and instead focus on essential information. Using whitespace, organized layouts, color-coding, and visual hierarchy helps students navigate charts efficiently. When charts become too dense, teachers can create multiple focused charts addressing specific aspects of broader topics rather than attempting to address everything in a single chart.
What role do students play in maintaining anchor charts throughout the year?
Students can take active roles in chart maintenance and utilization. Teachers might designate student chart managers responsible for ensuring charts remain visible and legible, or assign students to demonstrate chart usage to classmates who seem uncertain how to reference them. This ongoing student engagement reinforces the collaborative nature of the charts and keeps them active classroom resources rather than static displays.
References
- The Teacher’s Guide to Anchor Charts — Prodigy Math Game. 2024. https://www.prodigygame.com/main-en/blog/anchor-charts
- Creating Effective Anchor Charts in Your Minilessons — Center for Literacy and Learning at Lesley University. 2024. https://centerliteracyteaching.lesley.edu/effective-anchor-charts/
- How to Use Anchor Charts to Promote Independence — The Art of Education. 2018. https://theartofeducation.edu/2018/06/how-to-use-anchor-charts-to-promote-independence/
- Anchor Charts 101: Why and How To Use Them — We Are Teachers. 2024. https://www.weareteachers.com/anchor-charts-101/
- Anchor Charts — Colorín Colorado. 2024. https://www.colorincolorado.org/teaching-ells/ell-classroom-strategy-library/anchor-charts
- 10 Anchor Chart Ideas You’re Going to Want to Steal for Your Classroom — Teach Starter. 2024. https://www.teachstarter.com/us/blog/25-awesome-classroom-anchor-charts-us/
- 4 Essential Anchor Charts to Kick Off the School Year — Edutopia. 2024. https://www.edutopia.org/video/4-essential-anchor-charts-to-kick-off-the-school-year/

Medha Deb is an editor with a master's degree in Applied Linguistics from the University of Hyderabad. She believes that her qualification has helped her develop a deep understanding of language and its application in various contexts. Medha specializes in the areas of beauty, health, sports, and wellness and is committed to ensuring that the content on the website is…