
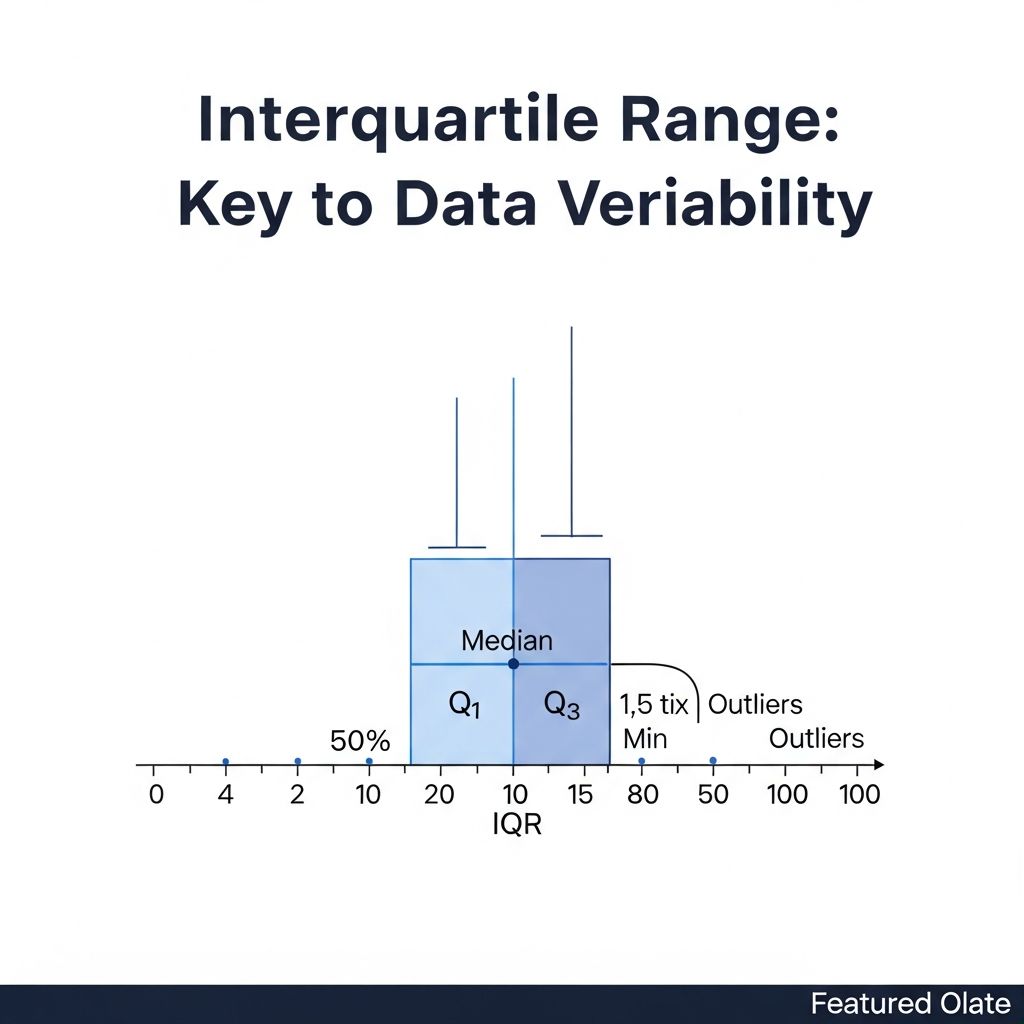
The **interquartile range (IQR)** quantifies the spread of the central 50% of a dataset, offering a robust measure of variability less influenced by extreme values than the traditional range. Calculated as the difference between the third quartile (Q3, 75th percentile) and first quartile (Q1, 25th percentile), IQR = Q3 – Q1, it provides clearer insights into data distribution.
Understanding Quartiles in Data Analysis
Quartiles divide an ordered dataset into four equal parts, each containing 25% of the data points. The first quartile (Q1) marks the boundary below which 25% of data lies, the second (Q2) is the median separating the lower and upper halves, and the third (Q3) leaves 25% above it.
These markers are crucial for summarizing distributions, especially in skewed datasets where means can mislead. For instance, in income data, quartiles reveal typical earnings better than averages distorted by high earners.
- Q1 (Lower Quartile): Median of the lower half of data.
- Q2 (Median): Central value splitting data evenly.
- Q3 (Upper Quartile): Median of the upper half.
Step-by-Step Guide to Calculating IQR
Computing IQR involves sorting data and identifying quartiles systematically. Here’s a detailed process:
- Sort the Dataset: Arrange values from smallest to largest, e.g., for {3, 7, 2, 9, 1, 5}, sorted: {1, 2, 3, 5, 7, 9}.
- Locate the Median (Q2): For even counts, average the two middle values; for odd, select the middle one. Here, average of 3 and 5 is 4.
- Split into Halves: Lower half: {1, 2, 3}; upper half: {5, 7, 9}.
- Find Q1 and Q3: Q1 = median of lower (2); Q3 = median of upper (7).
- Compute IQR: 7 – 2 = 5.
For larger datasets, use interpolation if positions fall between values, ensuring precision.
Example Calculations Table
| Dataset | Sorted | Median (Q2) | Q1 | Q3 | IQR |
|---|---|---|---|---|---|
| {1,3,4,5,6,7,9,9} | 1,3,4,5,6,7,9,9 | 5.5 | 3.5 | 8 | 4.5 |
| {10,20,30,40,50} | 10,20,30,40,50 | 30 | 15 | 45 | 30 |
This table illustrates IQR for even and odd datasets, highlighting consistency.
Why IQR Outperforms Traditional Range
The full range (maximum – minimum) is sensitive to outliers; a single extreme value skews it dramatically. IQR ignores these extremes, focusing on the middle 50%, making it ideal for real-world data with anomalies.
- Robustness: Unaffected by tails of distribution.
- Central Focus: Captures typical variability.
- Comparability: Enables fair dataset comparisons.
Consider test scores: {60, 65, 70, 75, 80, 99}. Range = 39, but IQR = 75 – 65 = 10, revealing tight central clustering.
Detecting Outliers with IQR Method
Outliers are values deviating significantly from the rest. The IQR rule flags them as below Q1 – 1.5×IQR or above Q3 + 1.5×IQR, a standard in box plots.
For the earlier example (Q1=2, Q3=7, IQR=5): Lower fence = 2 – 7.5 = -5.5; upper = 7 + 7.5 = 14.5. Values outside are outliers.
This 1.5 multiplier covers ~99.3% of normal distributions, balancing sensitivity and specificity.
Outlier Detection Workflow
| Step | Formula/Action | Example |
|---|---|---|
| Calculate IQR | Q3 – Q1 | 5 |
| Lower Fence | Q1 – 1.5(IQR) | -5.5 |
| Upper Fence | Q3 + 1.5(IQR) | 14.5 |
| Check Data | Flag extremes | None here |
Visualizing Data with Box Plots
Box plots (box-and-whisker) display IQR via a central box from Q1 to Q3, median line, and whiskers to non-outlier extremes. They reveal skewness, spread, and outliers at a glance.
- Box: IQR span.
- Whiskers: Extend to min/max within fences.
- Outliers: Plotted as points.
Multiple box plots compare distributions effectively, common in exploratory analysis.
Real-World Applications Across Fields
IQR’s robustness suits diverse scenarios:
- Finance: Volatility in stock returns, ignoring market crashes.
- Healthcare: Patient recovery times, excluding rare cases.
- Quality Control: Manufacturing tolerances, focusing on typical variation.
- Education: Test score spreads across classes.
In environmental monitoring, IQR assesses pollution levels without sensor glitches skewing results.
Advanced Topics: IQR in Non-Normal Distributions
For skewed data, IQR remains reliable where standard deviation fails. In multimodal datasets, it approximates overall spread.
Software implementations (Excel, R, Python) automate via QUARTILE or quantile functions, with adjustments for ties.
Common Misconceptions About IQR
- Myth: IQR equals median. Fact: It’s spread, not center.
- Myth: Always smaller than range. Fact: Yes, but uniform data may equal it.
- Myth: Useless for small samples. Fact: Valuable even for n=5.
Frequently Asked Questions (FAQs)
What is the formula for interquartile range?
IQR = Q3 – Q1, where Q1 is the 25th percentile and Q3 the 75th.
How does IQR differ from standard deviation?
IQR is non-parametric, outlier-resistant; SD assumes normality and is sensitive to extremes.
Can IQR be zero?
Yes, if central 50% values are identical, indicating no variability there.
Is IQR used in machine learning?
Yes, for feature scaling, outlier removal in preprocessing.
How to calculate quartiles in Excel?
Use =QUARTILE(array,1) for Q1, =QUARTILE(array,3) for Q3.
References
- Interquartile Range | Definition, Formula & Examples – Lesson — Study.com. 2023. https://study.com/academy/lesson/interquartile-range-definition-formula-example.html
- Interquartile Range (IQR): How to Find and Use It — Statistics By Jim. 2023-05-15. https://statisticsbyjim.com/basics/interquartile-range/
- Interquartile range — Wikipedia. 2025-01-20. https://en.wikipedia.org/wiki/Interquartile_range
- What Is the Interquartile Range (IQR)? — Outlier.org. 2024. https://articles.outlier.org/what-is-the-interquartile-range
- Interquartile Range (IQR) in Statistics — GeeksforGeeks. 2024-08-10. https://www.geeksforgegeeks.org/maths/interquartile-range/
- Interquartile Range (IQR) | Math with Mr. J — YouTube (Khan Academy collaborator style). 2023. https://www.youtube.com/watch?v=VABsJBw1JqA
- Interquartile range review — Khan Academy. 2025. https://www.khanacademy.org/math/cc-sixth-grade-math/cc-6th-data-statistics/cc-6th/a/interquartile-range-review

Medha Deb is an editor with a master's degree in Applied Linguistics from the University of Hyderabad. She believes that her qualification has helped her develop a deep understanding of language and its application in various contexts. Medha specializes in the areas of beauty, health, sports, and wellness and is committed to ensuring that the content on the website is…