
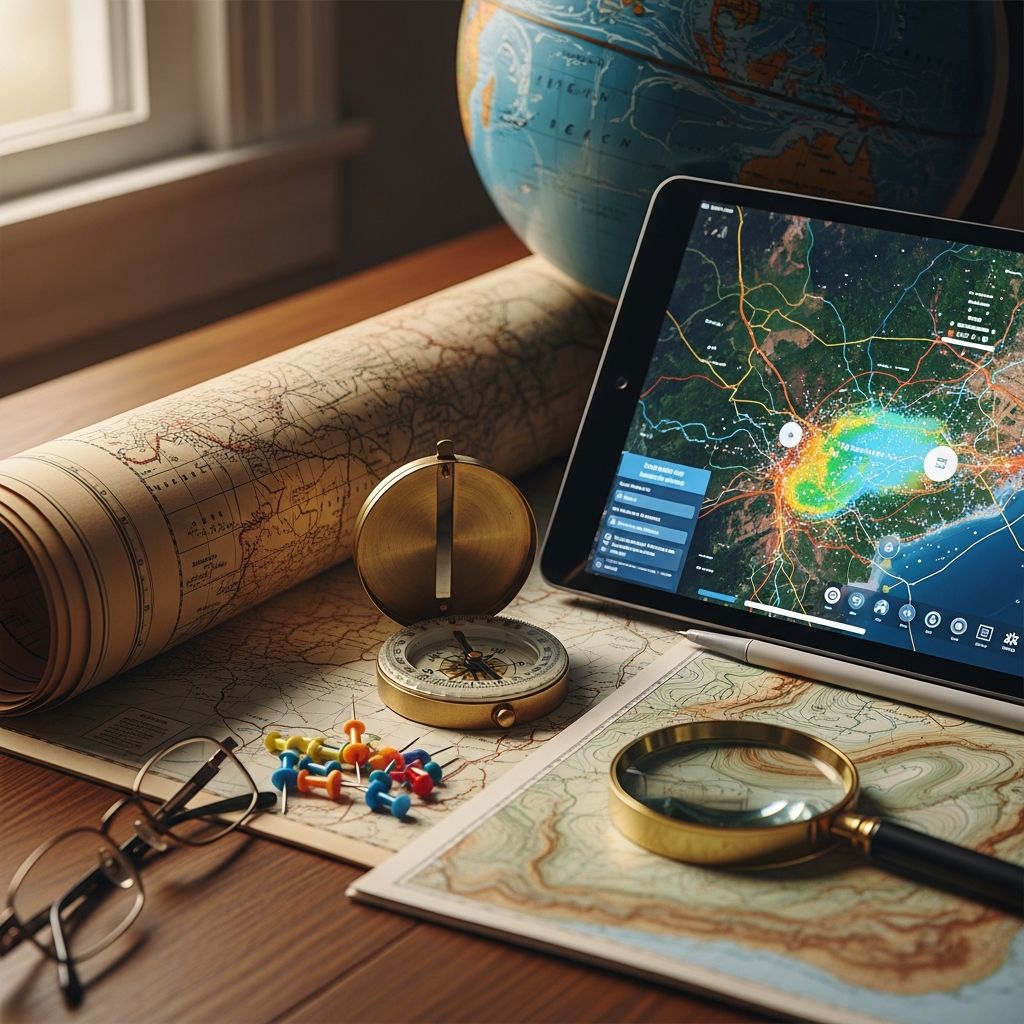
Foundations of Cartographic Representation
At its core, a map is a visual representation of geographic space that translates three-dimensional reality onto a two-dimensional surface. More precisely, maps are abstract interpretations of Earth’s physical features and spatial relationships, crafted to communicate specific information efficiently. Unlike a photograph, which captures everything within its frame, a map is deliberately selective, emphasizing certain elements while downplaying or completely removing others to serve a particular purpose.
The fundamental purpose of mapmaking is to bridge the gap between our understanding of vast territories and our ability to comprehend them in a manageable format. Whether examining a street map for directions or studying a weather map to plan outdoor activities, maps have become indispensable tools in modern life. They reduce complex geographical information into clear, comprehensible visual presentations that enable quick decision-making.
The Nature of Cartographic Interpretation
It is crucial to recognize that maps are never objective depictions of reality. Each map represents a subjective interpretation of place, filtered through the cartographer’s perspective, knowledge, and intentions. The choices a mapmaker makes about what to include, how to symbolize it, and what to omit all reflect their biases and agenda. This means that when you examine any map, critical thinking is essential—understanding not just what the map shows, but why those particular elements were selected for display.
The practice of cartography is fundamentally about strategic omission as much as strategic inclusion. No map can represent everything about a location without becoming impossibly complex and unusable. Instead, successful maps achieve clarity by systematically removing unnecessary details, allowing the map’s primary message to emerge clearly. A street map omits geological features; a geological map omits traffic patterns. This selectivity is not a limitation but rather the key to a map’s utility and effectiveness.
Essential Components That Make Maps Functional
Maps rely on several standardized elements to communicate geographic information effectively:
- Symbols and visual encoding: Maps employ consistent symbols, line styles, and color schemes to represent different geographic features and phenomena. A symbol might represent a city, a mountain, or a water source, with the specific design conveying meaning at a glance.
- Legends and keys: Nearly all maps include explanatory legends that decode the symbols used throughout the map, ensuring readers understand what each visual element represents.
- Scale representation: Maps include scale indicators that establish the relationship between distances on the map and actual distances on Earth’s surface. Understanding scale is essential for interpreting real-world distances from mapped information.
- Directional orientation: Most maps include compass roses or directional indicators to establish which direction represents north and the other cardinal directions.
- Projections: Since Earth is a sphere and maps are typically flat, cartographers use mathematical projections to translate the curved surface onto a plane.
Understanding Map Scale and Distance
Scale is one of the most important concepts in cartography, yet it is frequently misunderstood. Scale defines the mathematical relationship between a distance measured on the map and the corresponding distance on the ground. The simplest example is a 1:1 scale, which theoretically means one unit on the map equals one unit on the ground—essentially a life-size representation impossible for practical mapping.
Practical maps use much smaller scales. A scale of 1:63,360 indicates that one unit (such as one inch) on the map represents 63,360 of the same units on the ground. When that unit is an inch, this scale translates to one inch on the map equaling one mile in reality—a common scale for regional maps. Different purposes require different scales; detailed street maps use larger scales (showing more detail in smaller areas), while world maps use much smaller scales (showing less detail across vast territories).
Distinguishing Between Different Map Classifications
The cartographic universe contains numerous map types, each designed to highlight different aspects of geography. Two primary categories organize most maps:
Reference Maps: Establishing Location and Position
Reference maps prioritize showing where things are. These maps emphasize the spatial location of geographic phenomena—countries, cities, rivers, mountains, and other fixed features. Street maps, atlases, and world maps fall into this category. When you consult Google Maps to find a restaurant or examine a traditional road atlas to plan a driving route, you are using reference maps. Their primary strength lies in helping users identify the location of specific places and understand spatial relationships between different locations.
Thematic Maps: Revealing Patterns and Relationships
Thematic maps emphasize spatial patterns of specific attributes or statistics. Rather than showing where places are, thematic maps illustrate how particular phenomena are distributed across space. Weather maps display temperature, precipitation, and atmospheric pressure patterns. Population density maps show where people concentrate. Economic maps might display industries, trade flows, or income distribution. These maps excel at revealing relationships between geographic variables and helping analysts identify patterns that might not be obvious from raw data.
Beyond Geographic Representation
While most people associate maps exclusively with geographic space, cartographers have extended the concept of mapping far beyond Earth’s surface. Maps represent any space where spatial relationships matter:
- Astronomers map the heavens, charting stars, galaxies, and celestial phenomena.
- Biologists map chromosomes and genetic material, visualizing the organization of hereditary information.
- Medical professionals map the human body and its systems, illustrating anatomical and physiological relationships.
- Historians map historical events and territories, showing how political and cultural landscapes evolved over time.
- Archaeologists map excavation sites and artifact distributions.
This expanded understanding reveals that maps are fundamentally tools for representing spatial relationships in any domain, not merely geographic features.
Historical Evolution and Modern Manifestations
The history of mapping stretches back millennia. The ancient Egyptians represented maps as lists of place names in the order they would be encountered while following specific routes—a fundamentally different approach than modern visual maps. As technology evolved, maps transformed from hand-drawn charts to printed documents to digital, interactive displays.
Contemporary maps exist in multiple formats. Traditional paper maps remain valuable, providing tangible, persistent representations of space. Electronic maps displayed on computer screens and mobile devices offer interactivity, allowing users to zoom, pan, and customize displayed information. Some modern maps change dynamically, updating in real-time as conditions change—consider live traffic maps that reflect current congestion or weather maps that update hourly.
The Art and Science of Cartography
Cartography represents both an art and a science. The scientific dimension involves accurate measurement, mathematical projection, and precise data representation. The artistic dimension encompasses design choices that make maps aesthetically appealing and cognitively effective. Color selection, typography, symbol design, and layout all influence how well a map communicates its message.
Professional cartographers balance accuracy with clarity, precision with usability. Too much detail overwhelms readers; too little detail renders the map inadequate for its intended purpose. This balancing act requires deep understanding of both geographic information and human perception.
Practical Applications in Daily Life
Maps influence nearly every aspect of modern existence. Navigation applications rely on maps to guide travelers. Urban planners use maps to design cities and infrastructure. Environmental managers employ maps to monitor natural resources and conservation areas. Businesses use demographic and economic maps to identify target markets. Emergency responders depend on maps during crisis situations. Students consult maps while studying history, geography, and science. Athletes and outdoor enthusiasts use topographic maps to plan adventures.
The ubiquity of mapping technology—from smartphones with GPS to web-based mapping platforms—has made geographic information more accessible than ever before. Yet this accessibility sometimes obscures the sophisticated work that produces accurate, useful maps.
Specialized Map Categories and Their Purposes
| Map Type | Primary Focus | Common Applications |
|---|---|---|
| Topographic Maps | Natural and constructed features, elevation, terrain shape | Hiking, land development, construction planning |
| Political Maps | Boundaries, jurisdictions, governmental divisions | Governance, international relations, education |
| Climate and Weather Maps | Temperature, precipitation, atmospheric conditions | Weather forecasting, agricultural planning |
| Economic Maps | Industries, commerce, resources, trade patterns | Business analysis, economic development |
| Historical Maps | Past territorial extents, historical events, cultural evolution | Education, historical research, cultural understanding |
| Demographic Maps | Population distribution, density, characteristics | Marketing, urban planning, social analysis |
Reading and Interpreting Maps Effectively
Effective map reading requires systematic attention to several elements. Begin by identifying the map’s title and legend, which establish the map’s purpose and what symbols represent. Next, examine the scale to understand the relationship between map distances and real-world distances. Check the directional indicator to establish geographic orientation. Then study the geographic features shown, considering why the cartographer included some elements while omitting others. Finally, think critically about what the map reveals and what it conceals—what story does it tell, and what aspects of reality remain hidden?
Maps communicate information that is related to locations with remarkable efficiency. A single map can convey information that would require paragraphs of written description. This efficiency makes maps invaluable for rapid comprehension, decision-making, and spatial understanding.
Frequently Asked Questions About Maps
Q: Why do maps distort reality?
A: Maps necessarily distort reality because they translate a three-dimensional sphere onto a flat two-dimensional surface. Different projections create different distortions—some preserve area relationships, others preserve direction, and still others compromise both slightly to balance accuracy. Additionally, mapmakers deliberately simplify and select information to serve the map’s purpose, which inherently involves some distortion of reality.
Q: Can a globe be considered a map?
A: Yes. While most people think of maps as flat documents, globes are also maps in that they represent Earth’s surface on a spherical surface. Globes avoid the distortions inherent in projecting a sphere onto a flat plane, making them valuable tools for understanding global relationships, though their fixed scale and size limit their practical utility compared to flat maps.
Q: How has digital technology changed mapping?
A: Digital technology has revolutionized mapping by enabling interactive, dynamic maps that users can customize in real-time. GPS and satellite imagery provide unprecedented accuracy. Cloud computing allows massive datasets to be processed and visualized. Mobile applications put sophisticated mapping tools in everyone’s pocket. Live data feeds enable maps that reflect current conditions rather than static snapshots.
Q: What makes a map accurate?
A: Map accuracy depends on the quality of underlying data, the appropriateness of the projection method, the consistency of the scale, and the cartographer’s skill in representing spatial relationships. However, “accuracy” is contextual—a map accurate for one purpose might be inadequate for another. A road map’s accuracy differs from a topographic map’s accuracy requirements.
Q: Why do different map projections exist?
A: Because no single projection perfectly translates Earth’s spherical surface to a flat plane without distortion. Different projections preserve different properties—some maintain accurate distances, others preserve area relationships, still others preserve angular relationships. Cartographers choose projections based on the map’s purpose and geographic region.
References
- Maps & Cartographic Information: Definitions — University of Washington Libraries. Accessed April 2026. https://guides.lib.uw.edu/c.php?g=341594&p=6450816
- Cartographic Connections: What is a Map? — University of Texas at Arlington Libraries. Accessed April 2026. https://libguides.uta.edu/c.php?g=26755&p=164573
- Map — Wikipedia. Accessed April 2026. https://en.wikipedia.org/wiki/Map
- What is a Map – Map Definition — Caliper Corporation. Accessed April 2026. https://www.caliper.com/glossary/what-is-a-map.htm
- What Is a Map? — MATLAB & Simulink, MathWorks. Accessed April 2026. https://www.mathworks.com/help/map/what-is-a-map.html
- Map | Definition, History, Types, Examples, & Facts — Britannica. Accessed April 2026. https://www.britannica.com/science/map
- What is a Map? — Axis Maps. Accessed April 2026. https://www.axismaps.com/guide/what-is-a-map

Medha Deb is an editor with a master's degree in Applied Linguistics from the University of Hyderabad. She believes that her qualification has helped her develop a deep understanding of language and its application in various contexts. Medha specializes in the areas of beauty, health, sports, and wellness and is committed to ensuring that the content on the website is…