
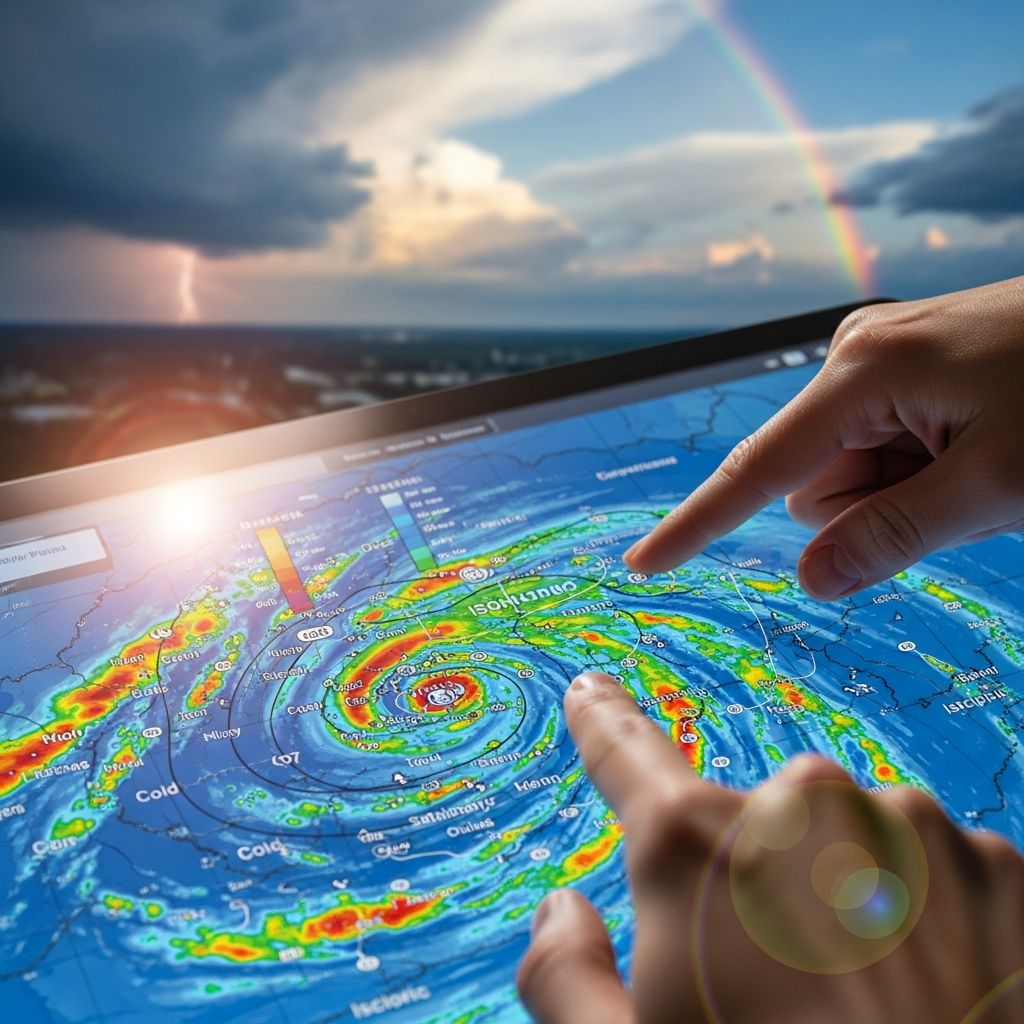
Weather maps serve as vital tools for visualizing atmospheric conditions, enabling anyone from casual observers to professional meteorologists to anticipate changes in the environment. These graphical representations condense complex data into readable formats, highlighting pressure systems, wind flows, precipitation, and temperature variations across regions. By grasping the symbols and patterns, individuals can make informed choices for travel, agriculture, aviation, and daily activities.
Foundations of Weather Map Analysis
At their core, weather maps provide snapshots of current or forecasted conditions. Surface maps depict ground-level phenomena, while upper-air charts reveal higher atmospheric dynamics. Key elements include labeled high (H) and low (L) pressure centers, contour lines known as isobars, and symbols for precipitation and cloud cover. Maps are typically valid for specific times, so checking the issuance date ensures relevance.
Begin by orienting yourself: locate your region and scan for major features. High-pressure areas often bring stable, clear weather, whereas lows signal unsettled conditions with potential storms. This initial overview sets the stage for deeper interpretation.
Decoding Pressure Patterns with Isobars
**Isobars** are lines connecting points of equal sea-level pressure, measured in millibars or hectopascals. They reveal wind potential and system strength. Closely spaced isobars indicate strong pressure gradients, leading to gusty winds, while widely spaced ones suggest calmer conditions.
- High-pressure systems (anticyclones): Circular isobars with increasing values toward the center promote sinking air, fostering dry, sunny weather.
- Low-pressure systems (cyclones or depressions): Isobars spiral inward with decreasing pressure, drawing in moist air that rises, often producing clouds and rain.
Trace isobar movement over sequential maps to predict system evolution. For instance, a deepening low (falling central pressure) intensifies storms, crucial for maritime safety.
Interpreting Wind Direction and Speed
Wind barbs, attached to station flags, convey both direction and speed. The line points toward the direction from which wind blows, with flags indicating velocity in knots: a full pennant equals 50 knots, long barbs 10 knots, short ones 5 knots, and a dot calm conditions.
In the Northern Hemisphere, winds flow counterclockwise around lows and clockwise around highs, a result of the Coriolis effect. This pattern aids in confirming pressure centers. For example, converging winds near a low signal approaching bad weather.
| Barb Feature | Wind Speed (knots) |
|---|---|
| Full pennant | 50 |
| Long barb | 10 |
| Short barb | 5 |
| Empty circle | Calm (<1) |
Aviation users prioritize these for flight planning, as headwinds or tailwinds impact fuel efficiency.
Recognizing Frontal Boundaries
Fronts mark transitions between air masses of differing temperature and humidity, depicted by colored lines with geometric symbols. These zones often produce the most dynamic weather.
- Cold front: Blue line with triangles pointing in the advance direction. Advances rapidly, lifting warm air to spawn heavy showers or thunderstorms, followed by cooler, clearer air.
- Warm front: Red line with semicircles on the upper side, facing cold air retreat. Approaches slowly, yielding steady rain from layered clouds, then warmer conditions.
- Occluded front: Purple line alternating triangles and semicircles. Forms when a cold front overtakes a warm front, trapping the warm air aloft and intensifying precipitation.
- Stationary front: Alternating symbols without clear direction, leading to prolonged cloudy, drizzly weather.
- Trough: Dashed black line indicating unstable air, prone to scattered showers.
Weakening fronts show crosses along the line, reducing weather contrasts. NOAA satellites like GOES-16 track these for timely alerts.
Precipitation and Radar Imagery Essentials
Surface maps use symbols for current weather: filled circles for drizzle, dots for rain, asterisks for snow, and thunderbolts for storms. Radar maps employ color codes for echo intensity—green for light rain, yellow/orange for moderate, red/purple for heavy downpours—plus motion vectors for storm paths.
These are indispensable for severe weather warnings, showing hail cores or tornado signatures. Combine with satellite imagery for cloud development insights.
Temperature and Cloud Cover Indicators
Temperatures appear as numbers near stations or color fills: reds/oranges for warmth, blues for cold. Gradients highlight frontal zones. Cloud symbols range from open circles (clear) to shaded ones (overcast), with fractions for partial cover.
These layers reveal stability: uniform temperatures suggest fair weather; sharp contrasts predict fronts.
Advanced Features: Ocean Currents and Upper Levels
Some maps overlay ocean currents via arrows or color flows, influencing coastal weather—warm currents like the Gulf Stream moderate climates. Upper-air maps (e.g., 500 mb) use thickness lines; the ‘528 line’ signals cold outbreaks and snow potential in winter.
Practical Steps for Daily Map Reading
- Check validity time and map type (surface, radar, etc.).
- Identify H/L centers and isobar spacing for wind/pressure clues.
- Locate fronts and predict associated weather.
- Assess precipitation symbols and radar motion.
- Correlate temperature, clouds, and winds for a full picture.
Practice with sequential charts to forecast changes, enhancing skills over time.
Weather Maps in Action: Real-World Applications
Agriculture relies on frost risks from cold fronts; aviation on wind shear from tight isobars. Emergency managers use radar for flood/evacuation planning. Even recreational sailors decode synoptic charts for safe passages.
Digital apps now animate these elements, but understanding static maps builds foundational expertise.
Frequently Asked Questions (FAQs)
What do closely packed isobars mean on a weather map?
They indicate a steep pressure gradient, resulting in stronger winds.
How can I tell a cold front from a warm front?
Cold fronts have triangles on a blue line pointing forward; warm fronts use semicircles on a red line.
What does a filled circle with a dot mean for precipitation?
It typically signifies light rain or drizzle.
Why are wind barbs crucial for pilots?
They provide precise speed and direction for safe routing and turbulence avoidance.
Can weather maps predict snow?
Yes, via cold fronts, low pressure, and thickness lines like 528 for wintry setups.
References
- How To Read a Weather Map — Meteomatics. 2023. https://www.meteomatics.com/en/weather-visualization/how-to-read-a-weather-map/
- How to Read a Weather Forecast: Key Symbols and Terms Explained — Climavision. 2023. https://climavision.com/blog/a-guide-to-weather-forecasts/
- How to interpret a weather chart — Royal Meteorological Society. 2023-10-01. https://www.rmets.org/metmatters/how-interpret-weather-chart
- How to Read a Weather Map — NESDIS/NOAA. 2023. https://www.nesdis.noaa.gov/about/k-12-education/weather-forecasting/how-read-weather-map
- Weather Map Interpretation — UBC EOAS. 2023. https://www.eoas.ubc.ca/courses/atsc113/sailing/met_concepts/11-met-marine-weather/11c-forecasting/
- Understanding synoptic charts — Bureau of Meteorology. 2023. https://www.youtube.com/watch?v=EDHd5jaoSvo

Medha Deb is an editor with a master's degree in Applied Linguistics from the University of Hyderabad. She believes that her qualification has helped her develop a deep understanding of language and its application in various contexts. Medha specializes in the areas of beauty, health, sports, and wellness and is committed to ensuring that the content on the website is…