
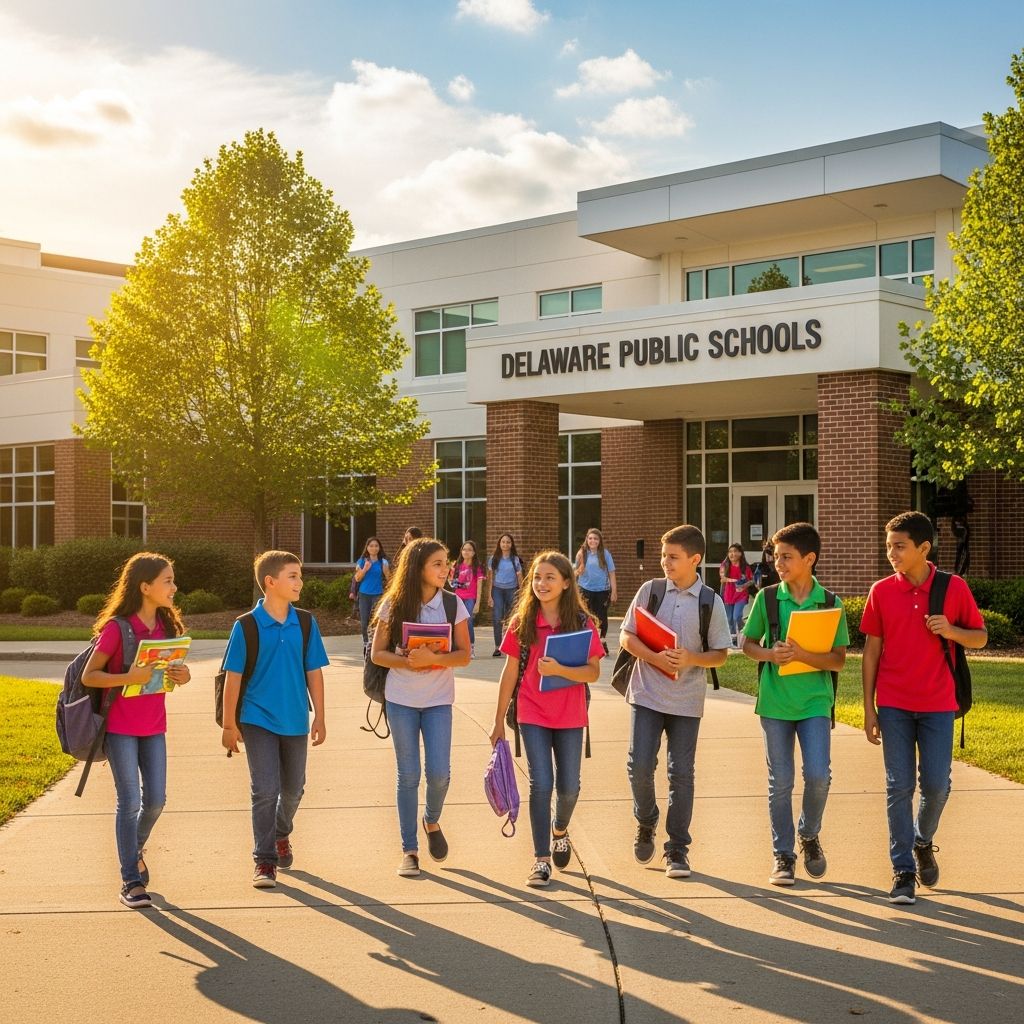
Delaware’s public education system encompasses 235 schools serving 141,946 students in the 2026 school year, ranking as the 52nd largest in the U.S. With 86% of K-12 students attending public institutions compared to the national 90% average, the state offers diverse options including charters, magnets, and specials.
System Overview and Enrollment Trends
Delaware public schools employ 9,932 teachers, yielding a student-teacher ratio of 14:1, which supports personalized attention. Enrollment breaks down across grades, with significant numbers in elementary and secondary levels. Minority students comprise 61%, predominantly Black, reflecting a diversity score of 0.71.
Statewide proficiency stands at 31% in math, 42% in reading, and 88% graduation rate. Free/reduced lunch eligibility affects 33% and 5% of students, respectively, indicating economic diversity.
- Total Schools: 235 public, plus 136 private serving 22,186.
- Special Types: 44 Blue Ribbon, 3 magnets, 23 charters, 18 special education.
- Largest Districts: Red Clay (14,771 students), Christina (13,092), Appoquinimink (12,804).
Top-Performing Public Schools
Leading schools excel in combined math and reading proficiency. Charter School of Wilmington tops with 87% math and 94% reading proficiency. North Star Elementary follows at 69% math and 77% reading.
| Rank | School Name | Math Proficiency | Reading Proficiency | Grades | Location |
|---|---|---|---|---|---|
| #1 | Charter School of Wilmington | 87% | 94% | 9-12 | Wilmington, DE |
| #2 | North Star Elementary School | 69% | 77% | K-5 | Wilmington, DE |
| #3 | Allen Frear Elementary School | 63% | 70% | K-5 | Hockessin, DE |
| #4 | MOT Charter School | 60% | 72% | K-12 | Middletown, DE |
These schools outperform state averages significantly, with many in the top 5-10% statewide.
Leading School Districts Ranked
Appoquinimink School District earns the #1 spot with an A Niche grade, praised for rigorous curriculum and extracurriculars across 21 schools and 13,129 students. Cape Henlopen ranks #2 (A grade), noted for inclusive culture in 9 schools serving 6,587.
| Rank | District | Niche Grade | Students | Schools | Key Strengths |
|---|---|---|---|---|---|
| 1 | Appoquinimink | A | 13,129 | 21 | Rigorous academics, sports |
| 2 | Cape Henlopen | A | 6,587 | 9 | Extracurriculars, welcoming admin |
| 3 | Red Clay Consolidated | A- | 14,546 | 28 | Nurturing, goal-oriented |
| 6 | Delmar | B+ | 1,451 | 3 | Supportive teachers |
| 9 | Smyrna | B | 6,010 | 8 | Growth opportunities |
Rankings factor test scores, graduation rates (88% state avg.), and reviews.
Demographic Breakdown and Equity
Delaware’s student body is diverse: 61% minority, with Black students leading. Districts like Red Clay and Brandywine (10,367 students) reflect urban diversity. Achievement gaps persist, with state efforts to close them via data-driven reports.
- Gender: Balanced across districts.
- Ethnicity: High minority in larger districts (e.g., 66% in some).
- Economic: 38% eligible for lunch programs.
Rodel reports over 200 public schools including vo-tech options, emphasizing access. NCES dashboards highlight trends in enrollment and performance.
Academic Performance Metrics
State averages: Math 31%, Reading 41-42%, Science 21%. Top schools exceed these, e.g., 87% math at Charter of Wilmington. Graduation at 88% supports college readiness in districts like Appoquinimink.
Financially, public education claims 35.8% of FY26 budget, underscoring investment.
School Types and Specialized Programs
Beyond traditional, Delaware features 23 charters like MOT (K-12, strong proficiency), 3 magnets, 44 Blue Ribbon honorees. Vo-tech and specials (18) cater to varied needs.
- Charters: Flexible, high-performing options.
- Magnets: Themed curricula.
- Special Ed: Targeted support.
Choosing the Right Public School
Parents compare via proficiency, ratios, and reviews. Popular pairings: Red Clay vs. Colwyck, Mariner vs. Beacon. Tools from DOE provide enrollment, performance data.
Future of Delaware Public Education
With FY26 funding priorities, focus remains on proficiency gaps and equity. Districts like Smyrna and Woodbridge (B grades) show growth potential.
Frequently Asked Questions
What are Delaware’s top public schools?
Charter School of Wilmington, North Star Elementary, and Allen Frear Elementary lead in proficiency.
How many public schools in Delaware?
235 public schools serve 141,946 students.
Public school attendance rate?
86% of K-12 students attend public schools.
Student demographics?
61% minority, majority Black; 14:1 ratio.
Best districts?
Appoquinimink (#1), Cape Henlopen (#2), Red Clay (#3).
This guide equips families with data for 2026 decisions, drawing from official stats.
References
- Best Public Schools in Delaware (2026) — PublicSchoolReview.com. 2026. https://www.publicschoolreview.com/delaware
- 2026 Delaware Schools Ratings — GreatSchools.org. 2026. https://www.greatschools.org/delaware/
- 2026 Best School Districts in Delaware — Niche.com. 2026. https://www.niche.com/k12/search/best-school-districts/s/delaware/
- Educational Data Reports — Delaware Department of Education. Accessed 2026. https://education.delaware.gov/community/data/reports/
- Delaware Public Education at a Glance — Rodel Foundation of Delaware. Accessed 2026. https://rodelde.org/ataglance/
- Delaware – Digest State Dashboard — National Center for Education Statistics. Accessed 2026. https://nces.ed.gov/programs/digest-dashboard/state/delaware
- FY 2026 Statewide Financial Overview — Delaware General Assembly. 2026. https://legis.delaware.gov/docs/default-source/cipdocuments/agencypresentations/fy26capitalstatewidefinancialoverview.pdf?sfvrsn=d7278b38_2

Medha Deb is an editor with a master's degree in Applied Linguistics from the University of Hyderabad. She believes that her qualification has helped her develop a deep understanding of language and its application in various contexts. Medha specializes in the areas of beauty, health, sports, and wellness and is committed to ensuring that the content on the website is…