
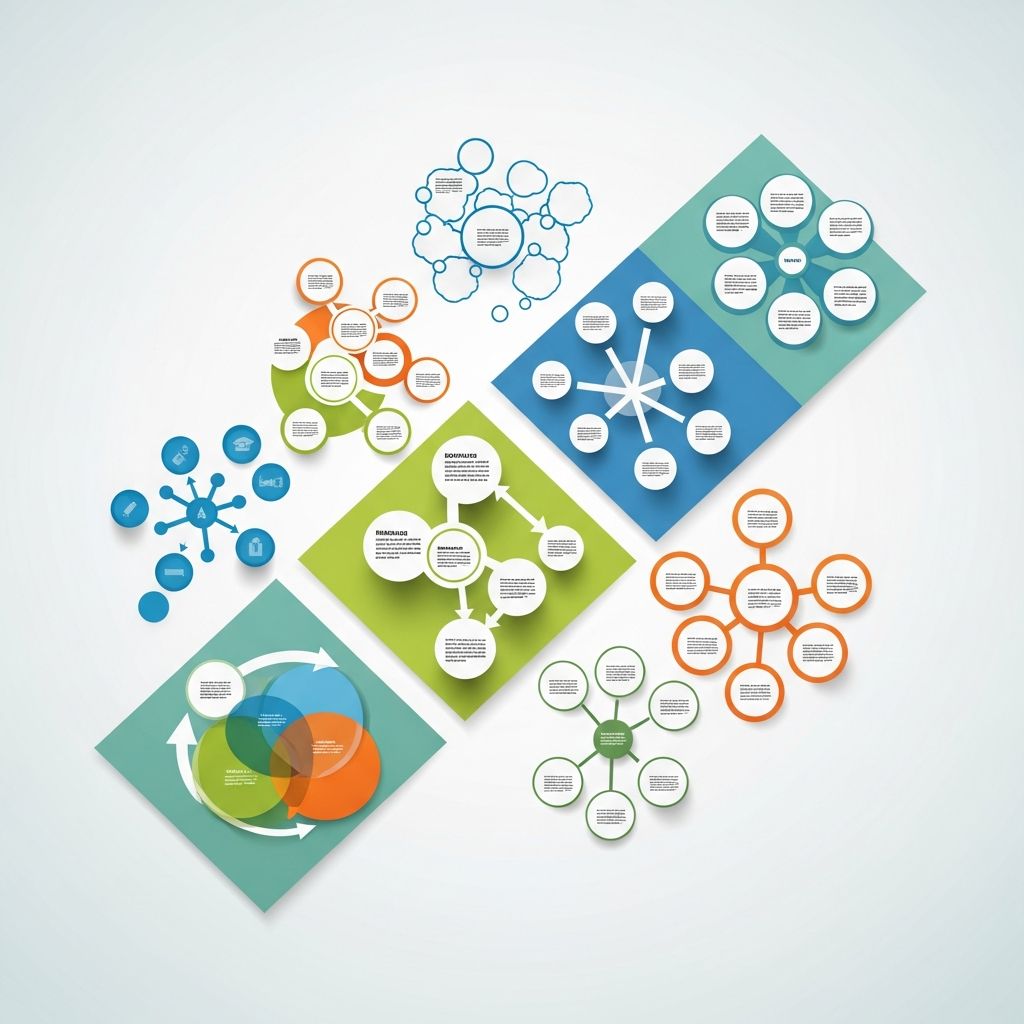
Graphic organizers are visual tools that transform abstract ideas into concrete representations, making complex information accessible and memorable. They support diverse learning styles by combining text, images, and spatial arrangements to foster deeper understanding. Educators worldwide use these diagrams to scaffold instruction, while students leverage them for note-taking, planning, and revision. This article delves into key types, their structures, educational applications, and proven benefits, drawing from established pedagogical practices.
Understanding the Power of Visual Aids in Education
Research consistently shows that visual processing accounts for a significant portion of human cognition. Graphic organizers tap into this by externalizing thoughts, revealing connections, and highlighting patterns that linear text often obscures. For instance, they reduce cognitive load during reading comprehension and essay writing, allowing learners to focus on content rather than structure. In classrooms, these tools promote active engagement, improve retention rates by up to 65% according to studies from educational institutions, and accommodate students with learning differences.
Whether brainstorming a project or analyzing literature, graphic organizers bridge the gap between input and output. They encourage nonlinear thinking, essential in today’s interdisciplinary world, and are adaptable across grade levels from elementary to higher education.
Brainstorming and Idea Generation Tools
At the heart of creativity lies the ability to generate and connect ideas freely. Several graphic organizers excel in this domain, providing flexible frameworks for initial exploration.
Mind Maps: Radiating Thoughts from a Core Concept
Mind maps start with a central keyword or image, from which branches extend like tree limbs, representing main ideas, subtopics, and details. This radial structure mirrors how the brain naturally associates information, making it ideal for whole-brain learning. Teachers use mind maps for topic overviews, such as mapping historical events around a pivotal figure, while students apply them in personal study to link vocabulary terms with examples and synonyms.
Key Benefits:
- Enhances memory through visual and spatial cues.
- Supports divergent thinking for creative writing or problem-solving.
- Scalable for individual or group activities.
In practice, a student mapping a science unit on ecosystems might place ‘Ecosystem’ at the center, branching to ‘Producers,’ ‘Consumers,’ and ‘Decomposers,’ with further details like food chains illustrated on sub-branches.
Spider Maps: Capturing Details Around a Theme
Similar to mind maps but with a more defined ‘body’ and ‘legs,’ spider maps focus on describing attributes of a single topic. The central circle holds the main subject, surrounded by eight ‘legs’ for key descriptors, facts, or examples. This format shines in character analysis for literature, where legs might detail physical traits, personality, motivations, and relationships.
Benefits include structured elaboration without overwhelming the page, perfect for younger learners building descriptive skills.
Comparison and Contrast Visualizers
Distinguishing similarities and differences is a cornerstone of critical thinking. Dedicated organizers make this process intuitive and visually compelling.
Venn Diagrams: Overlapping Insights
Comprising two or more intersecting circles, Venn diagrams place unique attributes in non-overlapping sections and shared traits in the intersection. This classic tool is ubiquitous in science for comparing animal classifications or in social studies for contrasting governments. For three items, triple Venns add complexity, ideal for advanced analysis.
| Element | Circle A (Apples) | Circle B (Oranges) | Intersection (Similarities) |
|---|---|---|---|
| Color | Red/Green | Orange | Juicy fruit |
| Texture | Smooth skin | Rough peel | Grown on trees |
| Use | Baking pies | Fresh eating | Rich in Vitamin C |
This table illustrates a simple Venn application, highlighting how visuals clarify relational data.
Double Bubble Maps: Nuanced Pairwise Analysis
Double bubble maps refine comparisons with bubbles for topics, linked bubbles for similarities, and standalone ones for differences. Unlike Venns, they avoid predefined shapes, allowing organic growth. Excellent for debating pros/cons of historical decisions or literary themes.
Hierarchical and Structural Organizers
Many concepts involve layers or sequences, best represented through branching or vertical flows.
Tree Charts: From Roots to Branches
Tree charts depict hierarchies, starting broad at the top (or root at bottom) and narrowing into specifics. Used for family trees, classification systems in biology, or organizational breakdowns in business classes. Each level represents a subcategory, fostering understanding of part-whole relationships.
Example: A language arts tree might root in ‘Narrative Elements,’ branching to ‘Plot,’ ‘Characters,’ ‘Setting,’ with sub-branches for ‘Exposition,’ ‘Climax,’ etc.
Flowcharts and Sequence Chains: Mapping Processes
Flowcharts use arrows, boxes, and diamonds to outline steps, decisions, and outcomes in a process. Sequence chains linearize events with arrows connecting boxes, perfect for historical timelines or scientific methods. These prevent confusion in procedural learning, like lab experiments or story plots.
Variations:
- Linear chains for simple timelines.
- Cyclic flows for repeating processes like water cycles.
- Decision trees with yes/no branches.
Analytical and Relational Diagrams
Cause-and-Effect Maps: Tracing Influences
These maps centralize an effect, with arrows pointing from multiple causes, or vice versa. Multi-flow variants show chains of consequences, invaluable for history (e.g., causes of wars) or environmental science. They cultivate analytical skills by prompting ‘why’ and ‘what next’ questions.
T-Charts: Quick Dual Comparisons
The simplest organizer, T-charts split a page into two columns for opposites like pros/cons, fact/opinion, or before/after. Their ease makes them starters for debates or reflections.
| Pros of Remote Learning | Cons of Remote Learning |
|---|---|
| Flexible scheduling | Limited social interaction |
| Access to global resources | Technical issues |
| Personalized pace | Distractions at home |
Advanced Organizers for Synthesis
Concept Maps: Weaving Knowledge Networks
Concept maps link propositions with labeled arrows, forming a web of interrelated ideas. Unlike mind maps, they emphasize causal links (e.g., ‘leads to,’ ‘requires’). Used in research planning or curriculum design, they reveal knowledge gaps.
Brace Maps: Deconstructing Wholes
For part-whole relationships, brace maps use nested braces to break down objects, like dissecting a sentence into subject-verb-object or a machine into components.
Implementing Graphic Organizers in the Classroom
Integration strategies maximize impact. Start lessons with organizers to activate prior knowledge, use mid-lesson for processing new info, and end with them for summarization. Digital tools like Lucidchart or Miro enhance collaboration. Differentiate by providing templates for novices and blank sheets for experts. Assess via rubrics focusing on completeness, accuracy, and insight.
Challenges include over-reliance; balance with discussion. Training teachers on variety ensures versatility.
Frequently Asked Questions (FAQs)
What are the most common graphic organizers?
The six primary categories include compare-contrast (Venns), writing aids (webs), reading tools (T-charts), teaching diagrams (flowcharts), learning maps (mind maps), and brainstorming clusters.
Which graphic organizer is best for beginners?
T-charts are simplest, requiring only two columns for immediate use in decision-making or sorting.
Can graphic organizers help students with disabilities?
Yes, they support visual learners and those with processing challenges by chunking information.
How do I choose the right organizer?
Match to task: hierarchies for classification, sequences for processes, comparisons for analysis.
Are digital graphic organizers better than paper?
Digital offer interactivity and sharing; paper provides tactile freedom—use both for best results.
Conclusion: Elevate Learning with Visual Strategy
Graphic organizers are not mere drawings but catalysts for intellectual growth. By systematically visualizing knowledge, they empower students to think critically, communicate effectively, and retain information long-term. Incorporate them routinely to witness transformative gains in engagement and achievement.
References
- 15 Graphic Organizers and How They Help Visualize Ideas — Visme. 2023-05-15. https://visme.co/blog/graphic-organizer/
- 20 Types of Graphic Organizers for Teachers and Students — Creately. 2024-02-10. https://creately.com/guides/types-of-graphic-organizers/
- Types of Graphic Organizers Explained — Miro. 2023-11-20. https://miro.com/graphic-organizer/types/
- Graphic Organizers — Learning Disabilities Association of America (.org). 2022-08-05. https://ldaamerica.org/info/graphic-organizers/
- Effective Graphic Organizers for Student Learning — Graduate Programs (.org). 2023-03-12. https://www.graduateprogram.org/blog/effective-graphic-organizers-for-student-learning/
- Types of Graphic Organizers for Education — Lucidchart Blog. 2024-01-18. https://www.lucidchart.com/blog/types-of-graphic-organizers-in-education

- Integrated M.A. in Applied Linguistics, University of Hyderabad
- 5+ years in editorial, instructional, SEO, and research-based writing
Sneha is a relationships and lifestyle writer with a strong foundation in applied linguistics and certified training in relationship coaching. She brings over five years of writing experience to theskillvault, crafting thoughtful, research-driven content that empowers readers to build healthier relationships, boost emotional well-being, and embrace holistic living. Her writing and insights reflect the belief that beauty, happiness, and wellness…