
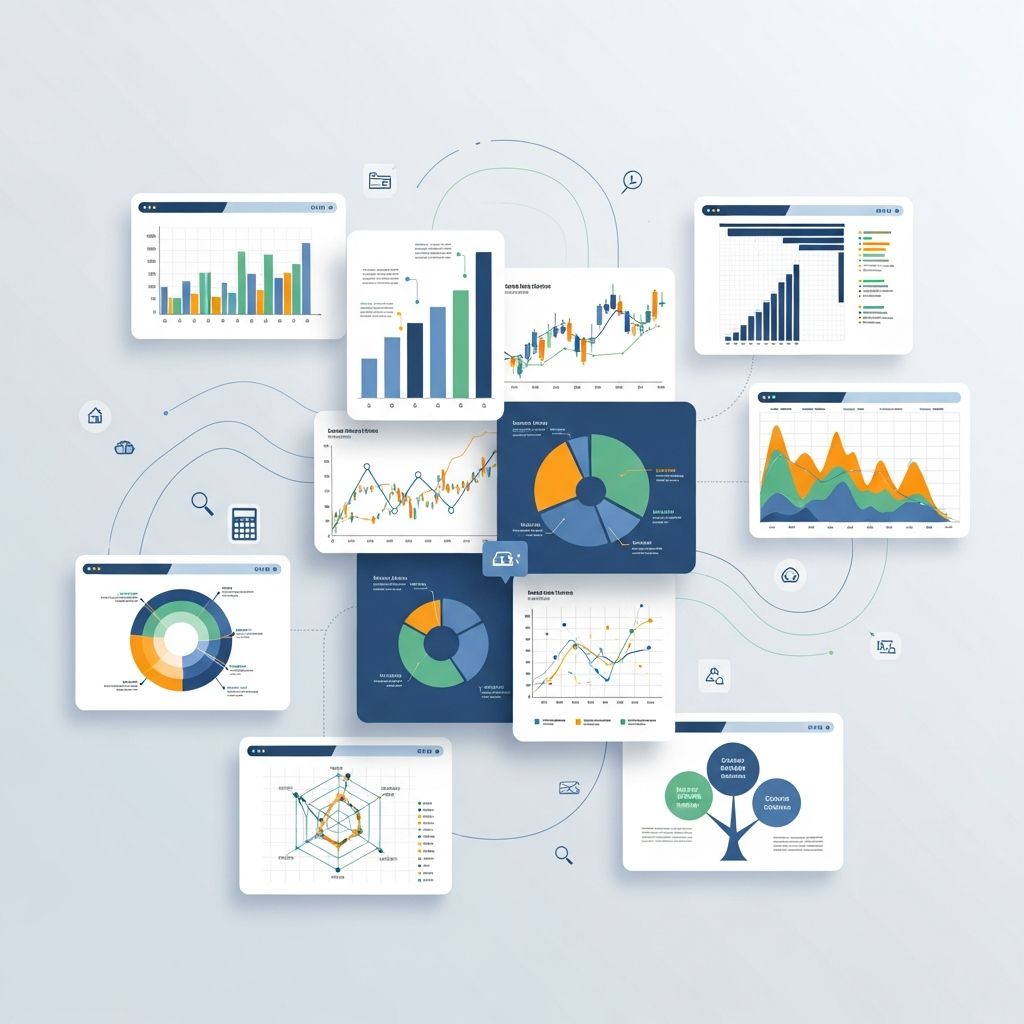
Graphs and charts serve as powerful tools to convert complex datasets into understandable visuals, enabling quicker decision-making and clearer communication. Selecting the appropriate type depends on the data’s nature and the story it needs to convey.
Understanding the Basics of Visual Data Representation
Visual representations simplify large volumes of information by highlighting patterns, trends, and relationships that might be obscured in raw numbers. They leverage human cognition’s strength in processing images over text, making them indispensable in reports, presentations, and dashboards.
Key principles include choosing simplicity, ensuring accuracy, and aligning the visual with the message. Overly complex designs can confuse audiences, while poor choices distort perceptions.
Essential Chart Types for Comparison
Comparison charts excel at juxtaposing values across categories, revealing differences and rankings at a glance.
Bar Charts: The Go-To for Categorical Comparisons
Bar charts use rectangular bars where length indicates magnitude, oriented horizontally or vertically. They shine in displaying discrete categories like sales by region or performance by team.
- Use for: Comparing distinct groups without time elements.
- Avoid when: Categories exceed 10-12, causing clutter.
Best practices involve clear axis labels, consistent scales, and color coding for emphasis.
Column Charts: Vertical Power for Quick Insights
Similar to bar charts but vertical, column charts suit rankings and short-term comparisons. They facilitate easy scanning from left to right.
- Ideal for: Budget allocations or quarterly results.
- Tip: Limit to 7 columns for readability.
Tracking Changes Over Time
Line Charts: Revealing Trends and Patterns
Line charts connect data points with lines to show progression, perfect for continuous variables like stock prices or website traffic.
- Strengths: Highlighting rises, falls, and forecasts.
- Enhancements: Multiple lines for comparisons, with legends.
For large datasets, thin lines or transparency prevent overlap.
Area Charts: Emphasizing Volume and Accumulation
Area charts fill beneath lines, illustrating totals and contributions over time. Stacked versions decompose wholes into parts.
- Best for: Cumulative data like revenue streams.
- Caution: Avoid with diverging trends to prevent misinterpretation.
Showing Proportions and Distributions
Pie and Donut Charts: Parts of a Whole
Pie charts divide circles into slices representing percentages. Donut variants add a center space for labels or metrics.
- Use sparingly: Limit to 5-7 slices.
- Alternative: When slices are similar, opt for bars.
They work well for budgets or market shares but falter with small segments.
Treemaps: Hierarchical Proportions
Treemaps nest rectangles sized by value, ideal for hierarchies like file sizes or organizational expenses.
- Advantages: Space-efficient for many categories.
- Design tip: Uniform aspect ratios for clarity.
Exploring Relationships and Correlations
Scatter Plots: Uncovering Connections
Scatter plots position points by two variables, revealing correlations, clusters, or outliers.
- Applications: Height vs. weight or sales vs. advertising spend.
- Add trend lines for linear relationships.
Bubble charts extend this by sizing points with a third variable.
Heatmaps: Density and Patterns in Grids
Heatmaps color cells in a matrix by value intensity, great for multivariate data like website clicks by hour and day.
- Benefits: Spotting hotspots without point overlap.
- Scale colors from low (light) to high (dark).
Advanced Visualizations for Specific Needs
Stacked and Grouped Bars: Layered Insights
Stacked bars show compositions within totals; grouped bars compare subcategories side-by-side.
| Chart Type | Use Case | Example |
|---|---|---|
| Stacked Bar | Total + breakdown | Monthly expenses by category |
| Grouped Bar | Subgroup comparisons | Sales by product and region |
Funnel Charts: Process Flows
Funnel charts depict stages in a process, widening at the top for drop-off visualization, common in sales pipelines.
- Superior to pies for sequential data.
Design Principles for Impactful Visuals
Effective charts prioritize clarity: declutter by removing unnecessary gridlines, use whitespace generously, and choose accessible colors.
- Labels: Descriptive, not cryptic.
- Scales: Start at zero unless justified.
- Colors: Semantic (e.g., red for negative).
Accessibility matters: Ensure high contrast and screen-reader compatibility.
Common Mistakes and How to Avoid Them
Missteps like 3D effects distort proportions; truncated axes mislead. Always test with fresh eyes.
- Pie overload: Switch to bars.
- Line for categories: Use bars instead.
- No context: Add titles and sources.
Choosing the Right Chart: A Decision Guide
| Data Type | Recommended Chart | Why |
|---|---|---|
| Categorical comparison | Bar/Column | Easy magnitude judgment |
| Time series | Line/Area | Trend visibility |
| Proportions | Pie/Donut/Treemap | Part-to-whole |
| Correlations | Scatter/Bubble | Relationship spotting |
| Hierarchies | Treemap | Nested views |
Match the chart to the question: What insight do you seek?
Tools and Software for Creating Charts
From Excel for basics to Tableau for interactivity, tools abound. Focus on those matching your skill level and needs.
FAQs
What is the most versatile chart type?
Bar charts dominate due to simplicity in comparisons.
Can pie charts handle many categories?
No, limit to 6; use alternatives for more.
How do I show three variables?
Bubble charts size points by the third metric.
Are 3D charts recommended?
Avoid; they skew perceptions.
What about dual-axis charts?
Use cautiously to compare disparate scales.
References
- 24 Types of Charts And Graphs For Data Visualization — ThoughtSpot. 2023. https://www.thoughtspot.com/data-trends/data-visualization/types-of-charts-graphs
- Charts and Graphs for Data Visualization — GeeksforGeeks. 2024-01-15. https://www.geeksforgeeks.org/data-visualization/charts-and-graphs-for-data-visualization/
- Essential Chart Types for Data Visualization — Atlassian. 2023. https://www.atlassian.com/data/charts/essential-chart-types-for-data-visualization
- 80 types of charts & graphs for data visualization (with examples) — Datylon. 2024. https://www.datylon.com/blog/types-of-charts-graphs-examples-data-visualization
- Common Types of Data Visualizations — Yale University Library. 2023-05-10. https://guides.library.yale.edu/datavisualization/types

- Integrated M.A. in Applied Linguistics, University of Hyderabad
- 5+ years in editorial, instructional, SEO, and research-based writing
Sneha is a relationships and lifestyle writer with a strong foundation in applied linguistics and certified training in relationship coaching. She brings over five years of writing experience to theskillvault, crafting thoughtful, research-driven content that empowers readers to build healthier relationships, boost emotional well-being, and embrace holistic living. Her writing and insights reflect the belief that beauty, happiness, and wellness…