
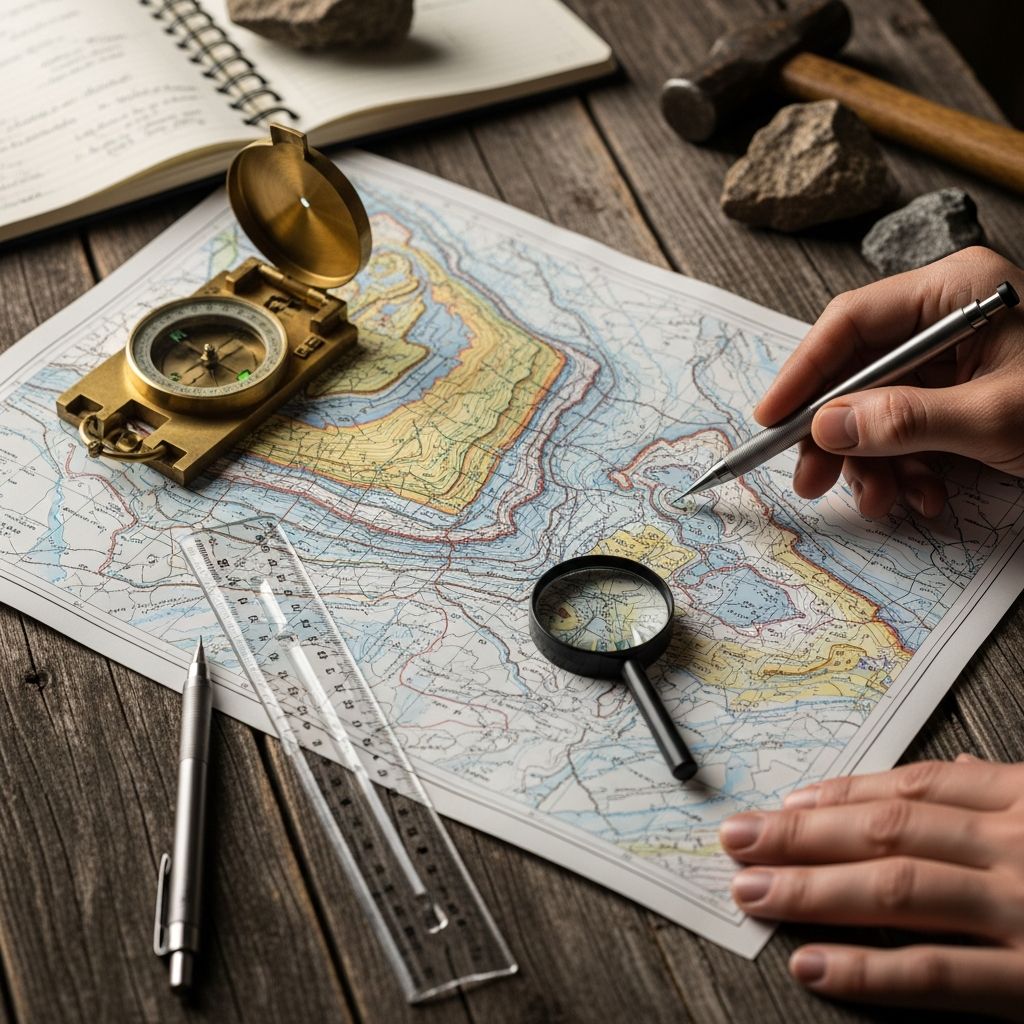
Geologic maps serve as essential tools for visualizing the composition, structure, and history of the Earth’s surface and subsurface. These maps overlay geological data on topographic bases, revealing rock types, ages, and structural features through colors, lines, and symbols. By mastering their interpretation, anyone can reconstruct past geological events and predict subsurface conditions.
Foundational Elements of Geologic Maps
Every geologic map builds upon a topographic base that includes contour lines, rivers, roads, and elevation markers. Contour intervals, often 40 feet, indicate elevation changes; closely spaced lines denote steep terrain, while widely spaced ones suggest gentle slopes. This base orients users spatially before adding geological overlays.
Map units, depicted in distinct colors or patterns, represent specific rock formations or sediment layers. Each unit carries a unique symbol, such as letters denoting geological periods or rock names, and descriptions in the explanation section detail their physical properties, age, and origin.
- Colors and Patterns: Differentiate rock types; warmer tones often for younger volcanic rocks, cooler for ancient sediments.
- Abbreviations: Like ‘Qs’ for Quaternary sediments or ‘Km’ for Cretaceous marine units.
- Scale: Relates map distances to real-world equivalents, e.g., 1:100,000 means 1 inch equals 100,000 inches on ground.
Decoding Boundaries and Contacts
Contacts mark transitions between map units. Solid lines show precise boundaries observed in outcrops, while dashed or hachured lines indicate approximate or inferred edges, often concealed by soil or vegetation. Faults, fractures where crust has shifted, appear as bold lines with symbols noting displacement direction and amount.
| Line Type | Meaning | Example Symbol |
|---|---|---|
| Solid black | Known contact or fault | — (straight) |
| Dashed | Approximate boundary | – – – (dotted) |
| Hachured | Concealed or queried | //// (teeth) |
Faults reveal tectonic movement: barbs on the hanging wall side point to thrust faults, while sawtooth patterns indicate normal faults with downthrown blocks.
Understanding Rock Orientation: Strike and Dip
Strike and dip symbols are crucial for three-dimensional interpretation. Strike, the compass direction of a horizontal line on a tilted plane, is shown as a long line with an azimuth number. Dip, the angle of tilt from horizontal, uses a short perpendicular line with degree notation pointing downhill.
For instance, a symbol with a strike of N30°E and 45°SE dip means rocks trend northeast-southwest and incline 45 degrees southeast. Vertical rocks show 90° dips; overturned sequences exceed 90°.
- Plunging Folds: Axes tilt; anticlines point noses downhill in V-patterns.
- Vertical Faults: No dip symbol; strikes parallel the fault trace.
Interpreting Structural Features
Folds and faults dominate structural geology on maps. Anticlines arch upward with oldest rocks central, limbs dipping outward; synclines trough downward with youngest central. V-shaped outcrop patterns in streams reveal dip direction: Vs point downstream on dipping beds, upstream on horizontal ones.
Rule of Vs: Streams carve Vs into dipping strata pointing in dip direction; horizontal layers show no Vs, dendritic drainage.
Unconformities, gaps in the rock record, appear as wavy contacts truncating older layers. Intrusions like dikes cross-cut host rocks.
Constructing Cross-Sections
Cross-sections provide vertical slices through the map area, illustrating subsurface layering. Select a straight line across diverse units, project strikes/dips onto it, and stack units by relative age, oldest at bottom.
- Draw profile line on map.
- Note elevations from contours.
- Project unit boundaries, faults, and dips vertically.
- Resolve overlaps by true dip angles.
- Label units per legend.
Sketches simplify: divide into domains by faults/unconformities, note dips/folds per region, annotate complexities.
Map Legends and Correlation Charts
The legend decodes all elements: unit descriptions list age, lithology (rock type), and thickness. Correlation columns stack units chronologically, youngest atop oldest, aiding three-dimensional visualization. Surficial maps emphasize recent deposits like alluvium over bedrock.
Practical Applications in Field and Beyond
Geologic maps guide hazard assessment, resource exploration, and land-use planning. In mining, they pinpoint ore bodies; in engineering, fault locations flag seismic risks. Surficial mapping in areas like Yellowstone tracks volcanic deposits and glacial till.
Field geologists sketch summary maps: highlight faults with throw/dip, folds as axial traces, younging arrows on beds.
Common Challenges and Tips
Uncertain contacts challenge novices; cross-reference with aerial photos or nearby outcrops. Steep terrain distorts dips—use stereonets for complex orientations. Always verify scale for accurate measurements.
- Start with legend mastery.
- Trace contacts systematically.
- Practice Vs on stream patterns.
- Build cross-sections iteratively.
Frequently Asked Questions (FAQs)
What does a dashed line on a geologic map indicate?
A dashed line represents an approximate or inferred boundary, often where rocks are covered by soil or vegetation.
How do you determine dip direction from stream patterns?
Streams form V-shapes pointing in the dip direction on inclined beds; upstream on horizontal layers.
Why are cross-sections included with geologic maps?
They reveal subsurface rock arrangements, folds, and faults not visible on the surface view.
What is a mappable unit?
A consistently recognizable rock formation traceable across the landscape, shown as a single color/pattern.
Can geologic maps predict earthquakes?
They identify active faults and past movements, informing seismic hazard zones.
Advanced Techniques for Experts
Digital maps integrate GIS layers for 3D modeling. Balanced cross-sections restore deformation, quantifying strain. Isopach maps contour layer thickness; structure contours map surface elevations.
In complex terranes, younging indicators (cross-bedding, graded beds) resolve overturned sequences. Stereographic projections analyze fold axes and fault planes statistically.
For surficial geology, differentiate glacial till (bouldery, unsorted) from alluvium (sorted sands). LiDAR enhances base maps, revealing subtle scarps.
Historical Context and Evolution
Modern geologic maps evolved from William Smith’s 1815 strata chart. USGS standardized symbols in the 19th century. Today, national surveys like BGS (UK) or USGS produce 1:24,000 scale sheets with cross-sections.
Objectives for readers: recognize features, sketch sections, summarize domains.
References
- Reading and Understanding Geological Maps — University of Leeds. Accessed 2026. https://www.see.leeds.ac.uk/fileadmin/Documents/geolog-mapping/Reading_and_Understanding_Geological_Maps.pdf
- Geologic Map | Definition, Symbols & Examples — Study.com. Accessed 2026. https://study.com/academy/lesson/video/understanding-interpreting-a-geologic-map.html
- How to Read a Geologic Map — Wisconsin Geological & Natural History Survey. Accessed 2026. https://home.wgnhs.wisc.edu/wisconsin-geology/how-to-read-geologic-map/
- Introduction to Geological Maps and Cross-sections — GeoLibreTexts. Accessed 2026. https://geo.libretexts.org/Bookshelves/Geology/GEOS:_A_Physical_Geology_Lab_Manual_for_California_Community_Colleges_(Branciforte_and_Haddad)/16:_Geological_Maps_and_Cross-sections/16.01:_Front_Matter
- How to Read a Geology Map — YouTube (Larry). Accessed 2026. https://www.youtube.com/watch?v=5IHpVuWcucc
- A deep dive into surficial geologic mapping — USGS. 2023-10-01. https://www.usgs.gov/observatories/yvo/news/a-deep-dive-surficial-geologic-mapping
- What is a Geologic Map? — New Mexico Bureau of Geology & Mineral Resources. Accessed 2026. https://geoinfo.nmt.edu/publications/maps/geologic/whatis.html

Medha Deb is an editor with a master's degree in Applied Linguistics from the University of Hyderabad. She believes that her qualification has helped her develop a deep understanding of language and its application in various contexts. Medha specializes in the areas of beauty, health, sports, and wellness and is committed to ensuring that the content on the website is…