
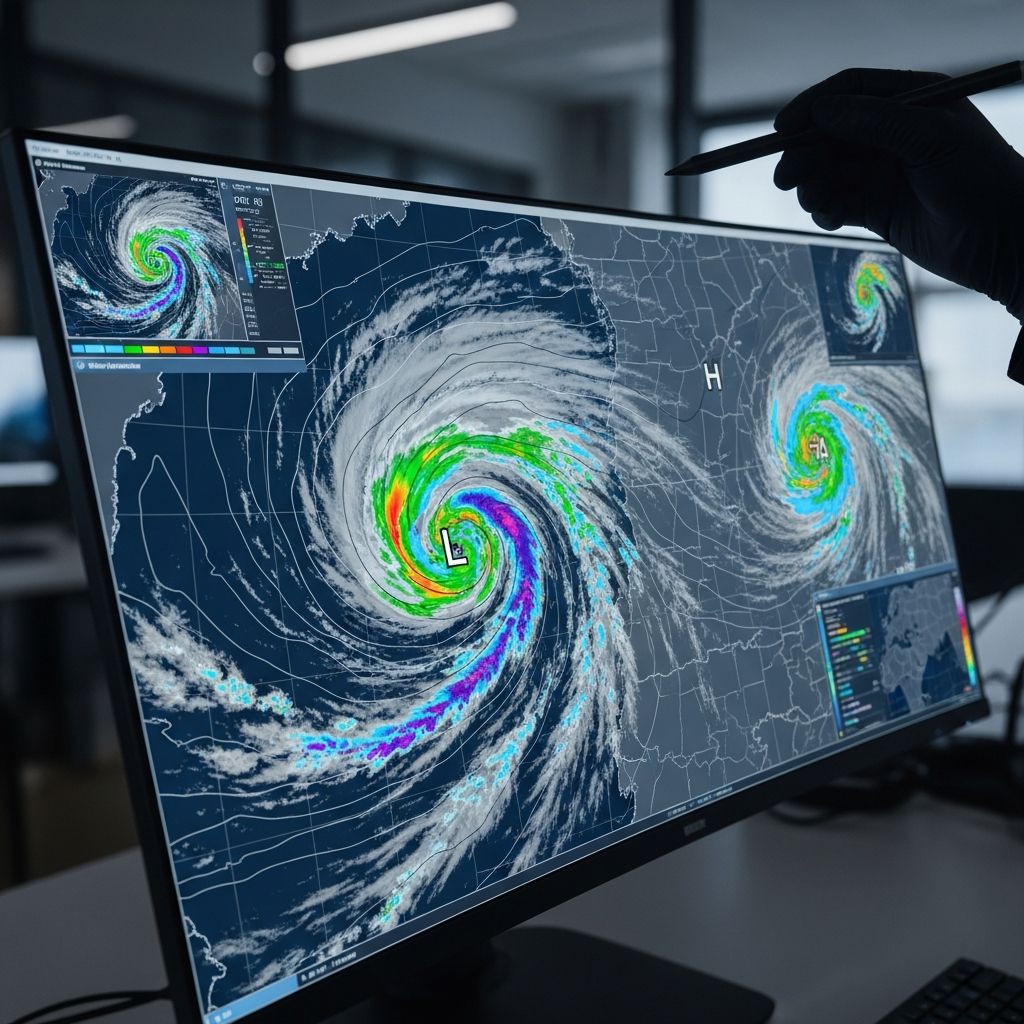
Weather maps serve as critical tools for understanding atmospheric conditions, enabling individuals to anticipate changes in weather patterns effectively. These visual representations condense vast amounts of data into comprehensible formats, aiding everyone from casual observers to professional meteorologists in making informed decisions.
Understanding the Basics of Surface Analysis Maps
Surface weather maps capture real-time conditions at ground level across regions, displaying key variables like pressure, temperature, and precipitation through standardized symbols. These maps provide a foundational snapshot, essential for grasping current weather states and short-term forecasts.
Stations plotted on these maps report data using icons: for precipitation, small dots indicate rain, while asterisks denote snow, and other shapes represent fog or thunderstorms. Temperature appears as numbers beside station circles, often color-coded for quick reference—reds for warmth, blues for cold.
Decoding Pressure Patterns with Isobars
Isobars, lines connecting points of equal atmospheric pressure, are central to weather map interpretation. They reveal wind speeds and system types: closely spaced lines signal strong winds due to steep gradients, while widely spaced ones suggest calmer conditions.
High-pressure centers, marked by ‘H’, feature isobars circling outward with increasing values, typically bringing stable, clear skies. Low-pressure areas, labeled ‘L’, show inward-spiraling isobars with decreasing values, often linked to unsettled weather like rain or storms.
| Pressure Type | Isobar Pattern | Typical Weather | Wind Strength |
|---|---|---|---|
| High Pressure (H) | Circles outward, higher center | Clear, sunny | Light |
| Low Pressure (L) | Circles inward, lower center | Cloudy, rainy | Strong |
This table summarizes isobar characteristics for rapid identification.
Interpreting Radar Imagery for Precipitation
Radar maps excel at tracking precipitation intensity and movement using color scales. Green shades show light rain, yellow moderate, and reds or purples intense downpours or hail. Arrows or motion indicators reveal storm directions, vital for severe weather alerts.
These dynamic maps update frequently, helping predict when rain arrives or if thunderstorms intensify. For instance, a hook echo on radar often signals potential tornado development.
Recognizing Frontal Boundaries and Their Impacts
Fronts mark transitions between air masses, depicted as lines with unique symbols. Cold fronts, blue lines with triangles pointing forward, advance cooler air, frequently spawning narrow rain bands or thunderstorms followed by clearing.
Warm fronts, red lines with semicircles, usher in milder air with gradual cloud buildup and steady rain. Occluded fronts combine both, showing alternating triangles and semicircles, while stationary fronts use dots, indicating prolonged weather.
- Cold Front: Triangles; quick changes, gusty winds.
- Warm Front: Semicircles; widespread clouds, drizzle.
- Occluded Front: Mixed symbols; complex, multi-day effects.
- Stationary Front: Dots; persistent conditions.
Front passage often veers winds clockwise, a key observational clue.
Assessing Cloud Cover and Visibility
Cloud symbols at stations range from empty circles for clear skies to fully shaded for overcast. Half-filled circles denote partly cloudy, aiding visibility forecasts. Modern maps may use icons or percentages for precision.
Citizen observations via apps like GLOBE enhance these maps, contributing to broader climate data collection.
Temperature Distributions and Gradients
Temperature fields use color contours: oranges and reds for hot zones, blues and purples for cold. Sharp gradients near fronts highlight instability risks.
These patterns reveal heat waves or cold snaps, influencing daily planning.
Incorporating Ocean Currents and Winds
Some maps overlay ocean currents with arrows or color flows, showing warm (red) versus cool (blue) waters affecting coastal weather. Winds parallel isobars, curving around highs (clockwise in Northern Hemisphere) and lows (counterclockwise).
Mountainous terrain distorts isobars, creating leeward lows and windward highs, complicating local forecasts.
Advanced Features: Satellites and Upper-Air Data
Satellite imagery from GOES-R series detects water vapor, cloud tops, and fronts, improving storm tracking. JPSS satellites provide global temperature profiles for 7-day outlooks.
Upper-air maps with 500 mb contours forecast jet streams and long-range patterns.
Practical Applications for Everyday Use
Combining elements—spotting a low with a cold front approaching—predicts rain timing. Apps and sites like NOAA integrate these for mobile access.
Aviation, agriculture, and emergency services rely on accurate reads to mitigate risks.
Common Pitfalls in Map Reading
Avoid assuming wind direction solely from isobars over mountains; observe station reports. Differentiate analysis from forecast maps by valid times.
Overlook no single map: cross-reference radar, satellite, and models for confidence.
Frequently Asked Questions (FAQs)
What do closely packed isobars mean?
They indicate strong winds from a steep pressure gradient.
How are cold fronts symbolized?
Blue lines with triangles pointing in the direction of movement.
What colors show heavy rain on radar?
Red and purple hues.
Do high-pressure systems bring good weather?
Yes, typically clear and stable conditions.
How do satellites aid weather mapping?
They track clouds, vapor, and fronts in real-time.
Building Your Weather Forecasting Skills
Practice with daily maps from NOAA or MetService, noting predictions versus outcomes. Join citizen science for hands-on learning.
Understanding weather maps empowers proactive living, from event planning to travel safety. As climate evolves, these skills grow ever vital.
References
- How To Read a Weather Map — Meteomatics. 2023. https://www.meteomatics.com/en/weather-visualization/how-to-read-a-weather-map/
- Weather Forecasts — UCAR Center for Science Education. 2023-10-01. https://scied.ucar.edu/learning-zone/how-weather-works/weather-forecasts
- How to interpret a weather chart — Royal Meteorological Society. 2023. https://www.rmets.org/metmatters/how-interpret-weather-chart
- How to Read a Weather Map — NESDIS – NOAA. 2023-05-30. https://www.nesdis.noaa.gov/about/k-12-education/weather-forecasting/how-read-weather-map
- How to read weather maps — MetService. 2023. https://about.metservice.com/learning/how-to-read-weather-maps-a9y32
- Weather Map Interpretation — EOAS UBC. 2023. https://www.eoas.ubc.ca/courses/atsc113/sailing/met_concepts/11-met-marine-weather/11c-forecasting/

- Integrated M.A. in Applied Linguistics, University of Hyderabad
- 5+ years in editorial, instructional, SEO, and research-based writing
Sneha is a relationships and lifestyle writer with a strong foundation in applied linguistics and certified training in relationship coaching. She brings over five years of writing experience to theskillvault, crafting thoughtful, research-driven content that empowers readers to build healthier relationships, boost emotional well-being, and embrace holistic living. Her writing and insights reflect the belief that beauty, happiness, and wellness…