
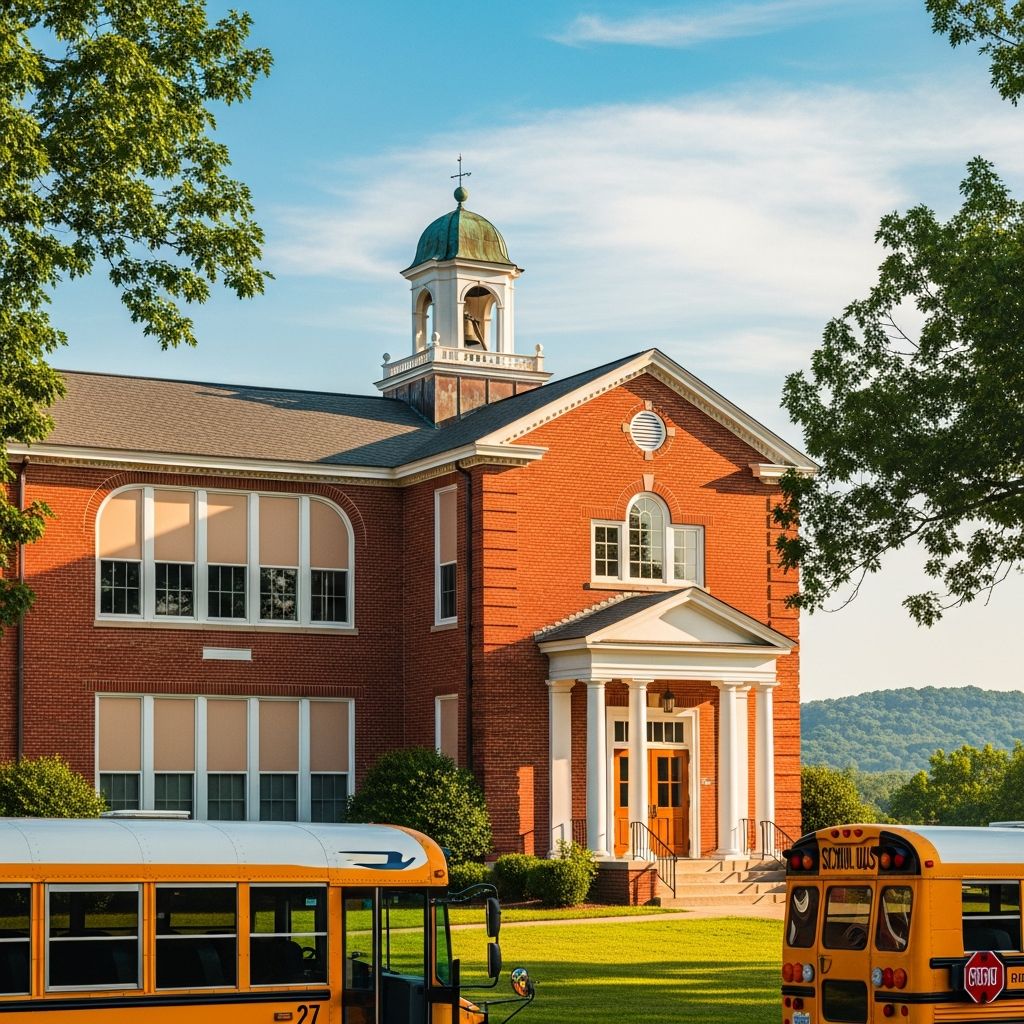
Kentucky maintains a robust public education system ranked as the 23rd largest in the U.S., educating 656,857 students through 1,534 schools in the 2026 school year. With 90% of K-12 students attending public institutions, the state emphasizes accessibility and performance improvement amid challenges like proficiency rates of 39% in math and 45% in reading.
Scale and Structure of Kentucky’s Public Education
The state’s public school network includes 1,484 to 1,534 schools, excluding specialized military-dependent districts and alternative programs. This encompasses preschools, elementary, middle, and high schools, totaling around 4,768 institutions when including private options, though public district schools number 1,746. Kentucky’s system operates on a 185-day calendar, featuring 170 instructional days, professional development, holidays, and planning periods.
Enrollment breaks down across grades, with significant numbers in elementary and secondary levels. The student-teacher ratio stands at 15:1, supported by 43,032 educators. Free and reduced lunch eligibility affects 56% and 3% of students, respectively, highlighting socioeconomic factors influencing education.
Academic Performance and Proficiency Metrics
Statewide averages reveal areas for growth: math proficiency at 38-39%, reading/language arts at 45-46%, and science at 23%. Graduation rates reach 90%, with ambitions to hit 95% (four-year) and 96% (five-year) by 2030. Kentucky’s diversity score of 0.46 reflects 28% minority enrollment, primarily Black and Hispanic students, alongside 5% identifying as two or more races and smaller groups like 1,217 Native Hawaiian students.
| Subject | State Average Proficiency (%) |
|---|---|
| Math | 38-39 |
| Reading/Language Arts | 45-46 |
| Science | 23 |
| Graduation Rate | 90 |
This table summarizes core metrics, underscoring the need for targeted interventions.
Standout Public Schools Across the State
High achievers like Greathouse/Shryock Traditional (magnet school with 85% math and 84% reading proficiency), SCAPA at Bluegrass, and Anchorage Independent Public School lead rankings based on combined test scores. Donald E. Cline Elementary also excels, posting 75-79% proficiency in both subjects, placing it in the top 1%.
These schools demonstrate potential within the system, often as magnet or Blue Ribbon institutions—Kentucky boasts 81 Blue Ribbon Schools, 64 magnet schools, and 9 special education facilities.
- Greathouse/Shryock Traditional: Top-ranked magnet with exceptional proficiency rates.
- SCAPA at Bluegrass: Strong performer in core academics.
- Anchorage Independent: Elite independent public school.
- Donald E. Cline Elementary: Top 1% in math and reading.
Leading School Districts in Kentucky
Largest districts by enrollment include Jefferson County (95,230 students, 181 schools in Louisville), Fayette County (41,422 students, 85 schools in Lexington), Boone County (20,200 students, 30 schools in Florence), Warren County (17,799 students, 37 schools in Bowling Green), and Hardin County (14,675 students, 28 schools in Elizabethtown). Quality rankings from sources like Niche highlight Boyle County Schools (A grade, Danville), Pulaski County (A-, Somerset), and Campbell County (A-, Alexandria) as top performers based on test scores, graduation, and teacher quality.
| District | Students | Schools | Location | Niche Grade |
|---|---|---|---|---|
| Jefferson County | 95,230 | 181 | Louisville | N/A |
| Fayette County | 41,422 | 85 | Lexington | N/A |
| Boyle County | 2,932 | 7 | Danville | A |
| Pulaski County | 7,840 | 14 | Somerset | A- |
| Campbell County | 5,180 | 10 | Alexandria | A- |
Popular areas like Newburg, Picadome, Old Louisville, Pleasure Ridge Park, and Eastside host multiple schools.
County-Level Excellence in Public Education
Best districts by county emphasize consistent high performance. Boyle County stands out for pushing student success through dedicated staff. Pulaski County offers diverse pathways like biomedical science. Campbell County prioritizes safety and college readiness. These districts exemplify how localized efforts elevate statewide standards.
State Initiatives and Future Goals
Kentucky’s education strategy, shaped by Senate Bill 1 (2017), HB 520 (charter authorization), and others, focuses on rigorous standards, assessments, and improvement. The Consolidated State Plan aims for 100% proficiency by closing gaps 50% by 2030, with intermediate targets from a 2018-2019 baseline.
Key objectives include higher achievement, equity reporting, high expectations, improved school climate, and transparent performance communication. The Kentucky Board of Education prioritizes vibrant learning under the United We Learn vision for 2025-2026. Title I and non-Title I schools receive targeted or comprehensive support based on accountability.
- Increase academic proficiency significantly across all groups.
- Boost graduation to 95-96%.
- Enhance school safety and culture.
- Promote continuous improvement.
Diversity, Equity, and Resource Allocation
Minority students comprise 28% of enrollment, with efforts to address gaps. Funding supports equitable resource distribution, high-quality instruction, and aligned assessments. Councils serve 1,138 schools, aiding local governance.
Challenges and Opportunities Ahead
While proficiency lags national benchmarks in some areas, strengths in graduation and top schools signal progress potential. Legislative priorities for 2025-2026 emphasize learning experiences and systemic enhancements. Families can explore options via district ratings, proficiency data, and state resources to find ideal fits.
Frequently Asked Questions
What are Kentucky’s top public schools?
Leading institutions include Greathouse/Shryock Traditional, SCAPA at Bluegrass, Anchorage Independent, and Donald E. Cline Elementary.
How many public schools operate in Kentucky?
There are 1,534 public schools serving 656,857 students.
What are the largest school districts?
Jefferson County (95,230 students), Fayette County (41,422), and Boone County (20,200) top the list.
What proficiency rates define Kentucky public schools?
Math: 38-39%, Reading: 45-46%, Science: 23%, Graduation: 90%.
What goals guide Kentucky’s education system?
Aiming for 100% proficiency, 95%+ graduation by 2030, equity, and improved climate.
References
- Best Public Schools in Kentucky (2026) — PublicSchoolReview.com. 2026. https://www.publicschoolreview.com/kentucky
- 2026 Kentucky Schools | Public, Charter, & Private School Ratings — GreatSchools.org. 2026. https://www.greatschools.org/kentucky/
- Kentucky Education Facts — Kentucky Department of Education. Accessed 2026. https://education.ky.gov/comm/edfacts/Pages/default.aspx
- Public Comment_Kentucky Consolidated State Plan February 2026 — Kentucky Department of Education. 2026-01-23. https://content.govdelivery.com/attachments/KYDE/2026/01/23/file_attachments/3531411/Public%20Comment_Kentucky%20Consolidated%20State%20Plan%20February%202026.pdf
- Kentucky Board of Education members approve goals, legislative priorities — Kentucky Teacher. 2025-10. https://www.kentuckyteacher.org/news/2025/10/kentucky-board-of-education-members-approve-goals-legislative-priorities/
- 2026 Best School Districts in Kentucky – Niche — Niche.com. 2026. https://www.niche.com/k12/search/best-school-districts/s/kentucky/

Medha Deb is an editor with a master's degree in Applied Linguistics from the University of Hyderabad. She believes that her qualification has helped her develop a deep understanding of language and its application in various contexts. Medha specializes in the areas of beauty, health, sports, and wellness and is committed to ensuring that the content on the website is…