
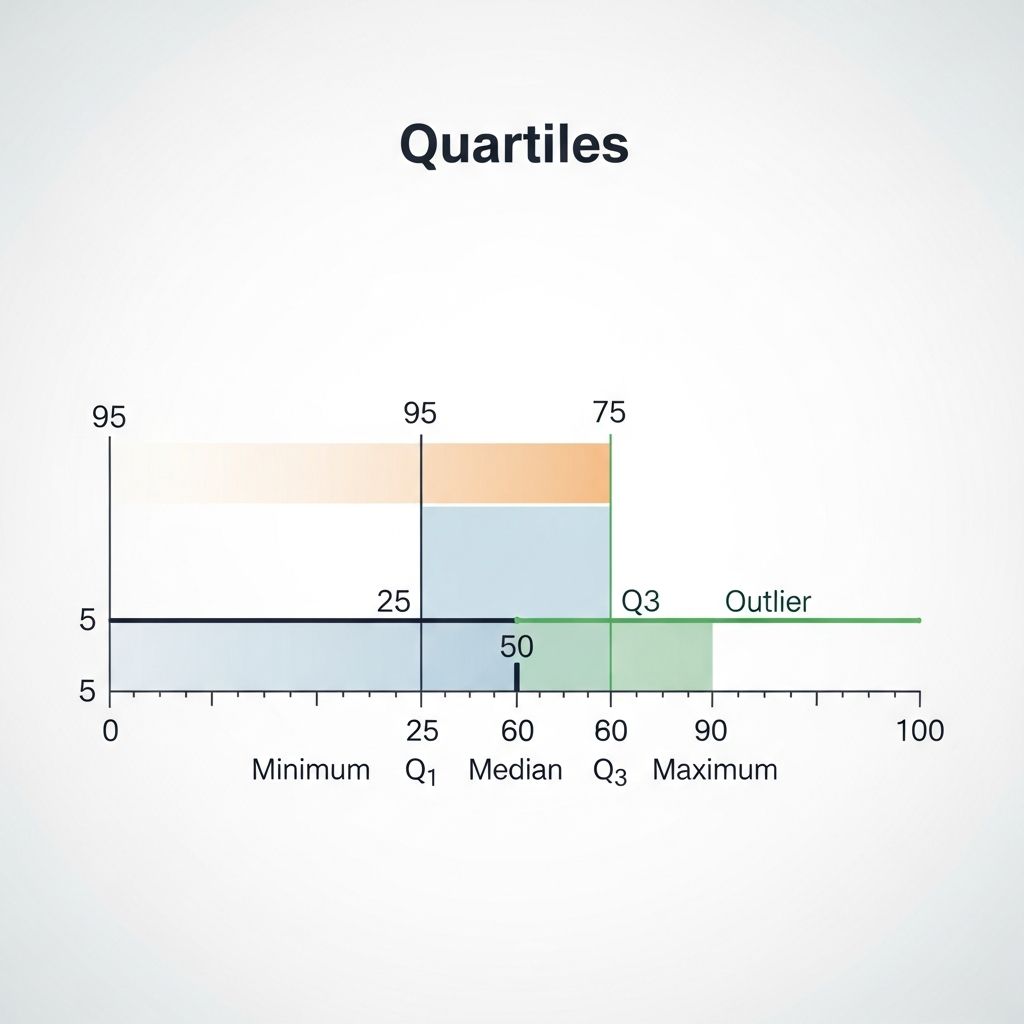
Quartiles serve as fundamental tools in descriptive statistics, partitioning ordered data into four equal segments to reveal distribution patterns. The **first quartile (Q1)** marks the 25th percentile, separating the lowest 25% of data, while the **third quartile (Q3)** indicates the 75th percentile, isolating the top 25%.
Core Concepts of Quartiles
Statistics relies on measures that summarize data spread and central tendency. Quartiles extend beyond simple averages by dividing datasets into quarters. For any ordered dataset, Q1 captures the boundary after the bottom quarter, Q2 (the median) splits the middle, and Q3 defines the end of the third quarter.
This segmentation proves invaluable for skewed distributions where means mislead. By focusing on positional values, quartiles offer robust insights unaffected by extreme values.
Defining the First Quartile (Q1)
The first quartile, or lower quartile, represents the value below which 25% of observations fall. In a sorted list, it acts as the median of the lower half, excluding the overall median in even-sized sets.
- Position calculation: For n observations, locate at position (n + 1)/4.
- Interpolation needed if position falls between integers.
- Resistant to outliers, making it superior to minimum values for lower-bound analysis.
Defining the Third Quartile (Q3)
Conversely, the third quartile, or upper quartile, denotes the value below which 75% of data resides. It equals the median of the upper half of the dataset.
- Position: 3(n + 1)/4.
- Highlights upper data concentration.
- Essential for assessing asymmetry in distributions.
Step-by-Step Calculation Methods
Computing quartiles involves sorting data first, then applying positional formulas. Different software uses slight variations, but core principles align.
Manual Calculation Process
- Sort data ascendingly.
- Compute n, total observations.
- For Q1: Find position n/4; average adjacent if non-integer.
- For Q3: Position 3n/4; average as needed.
- Verify with median (Q2) at n/2.
Example Dataset: Scores: 5, 7, 8, 12, 15, 18, 21, 25, 30, 35 (n=10).
- Lower half (5 values): Median of 5,7,8,12,15 is 8 (Q1).
- Upper half (5 values): Median of 15,18,21,25,30 is 21 (Q3).
Handling Even and Odd Dataset Sizes
| Dataset Size | Q1 Calculation | Q3 Calculation | Example |
|---|---|---|---|
| Odd (n=9) | Median of first 4 values | Median of last 4 values | 1,2,3,4,5,6,7,8,9 → Q1=2.5, Q3=7.5 |
| Even (n=8) | Average positions 2 & 3 | Average positions 6 & 7 | 1,2,3,4,5,6,7,8 → Q1=2.5, Q3=6.5 |
Such methods ensure consistency across tools like Excel or R, though minor discrepancies arise from rounding rules.
Interquartile Range: Measuring Variability
The **interquartile range (IQR)** quantifies middle 50% spread: IQR = Q3 – Q1. Unlike standard deviation, IQR ignores extremes, ideal for non-normal data.
- Small IQR signals tight clustering.
- Large IQR indicates dispersion.
- Outlier detection: Values beyond Q1 – 1.5×IQR or Q3 + 1.5×IQR flagged.
Example continuation: IQR = 21 – 8 = 13. Fences: Lower = 8 – 1.5(13) = -11.5; Upper = 21 + 19.5 = 40.5. Thus, 5 and 35 within bounds.
Visualizing with Box Plots
Box plots, or box-and-whisker diagrams, graphically depict quartiles. The box spans Q1 to Q3, median line inside, whiskers to min/max or fences.
- Center line: Q2.
- Box edges: Q1, Q3.
- Whiskers: Adjacent non-outliers.
- Dots: Outliers.
Comparing distributions side-by-side reveals skewness, spread differences, and multimodality effectively.
Practical Applications Across Fields
Quartiles underpin real-world analysis in diverse domains.
Finance and Economics
Income studies use Q1/Q3 to report typical earnings, bypassing billionaire skew. Stock returns employ IQR for volatility excluding flash crashes.
Healthcare Analytics
Patient recovery times: Q3 identifies when 75% discharged, aiding resource planning. BMI distributions highlight obesity thresholds via quartiles.
Education and Testing
Exam scores: Q1/Q3 define proficiency bands, outperforming averages in heterogeneous classes.
Quality Control
Manufacturing defects: IQR monitors process stability, triggering interventions beyond specs.
These applications underscore quartiles’ versatility beyond academia.
Advanced Topics: Variations and Software
Quartile methods vary: Tukey’s hinges exclude medians; Moore/ McNeil includes. Hyndman-Fan lists 9 conventions; Excel uses 7.
Software handling:
- R: quantile() with type=7 default.
- Python (NumPy): np.percentile(array, [25,75]).
- Excel: QUARTILE.INC or EXC functions.
Always document method for reproducibility.
Common Pitfalls and Best Practices
Missteps include unsorted data or method confusion. Best practices:
- Sort meticulously.
- Report calculation type.
- Pair with histograms for context.
- Use IQR over range for skewed data.
Frequently Asked Questions (FAQs)
What distinguishes Q1 from the minimum value?
Q1 encloses 25% data, robust to lows; minimum is sensitive to outliers.
Why prefer IQR to standard deviation?
IQR focuses on central 50%, non-parametric, outlier-resistant.
Do all quartile methods yield identical results?
No; positional rounding varies, but differences minor for large n.
How do quartiles aid outlier identification?
1.5×IQR rule flags extremes beyond fences.
Can quartiles apply to non-numeric data?
Yes, via ordinal ranks in ranked categories.
Conclusion: Empowering Data Insights
First and third quartiles unlock nuanced data understanding, from spread to anomalies. Integrating them with visuals like box plots enhances communication. As datasets grow complex, mastering these tools remains essential for analysts everywhere.
References
- Quartile – Wikipedia — Wikimedia Foundation. 2023-10-15. https://en.wikipedia.org/wiki/Quartile
- Quartiles & Quantiles | Calculation, Definition & Interpretation — Scribbr. 2023-08-10. https://www.scribbr.com/statistics/quartiles-quantiles/
- What Are Quartiles? Statistics 101 — Outlier.org. 2023-05-22. https://articles.outlier.org/what-are-quartiles-in-statistics
- Quartile Calculator | Interquartile Range Calculator — CalculatorSoup. 2023-11-01. https://www.calculatorsoup.com/calculators/statistics/quartile-calculator.php
- Quartiles and Box Plots — University of Illinois Data Science Discovery (.edu). 2024-01-12. https://discovery.cs.illinois.edu/learn/Exploratory-Data-Analysis/Quartiles-and-Box-Plots/
- Finding Q1, Q3, and IQR — YouTube (Khan Academy-style tutorial). 2022-09-05. https://www.youtube.com/watch?v=RMOmAn2ShR0

- Integrated M.A. in Applied Linguistics, University of Hyderabad
- 5+ years in editorial, instructional, SEO, and research-based writing
Sneha is a relationships and lifestyle writer with a strong foundation in applied linguistics and certified training in relationship coaching. She brings over five years of writing experience to theskillvault, crafting thoughtful, research-driven content that empowers readers to build healthier relationships, boost emotional well-being, and embrace holistic living. Her writing and insights reflect the belief that beauty, happiness, and wellness…