
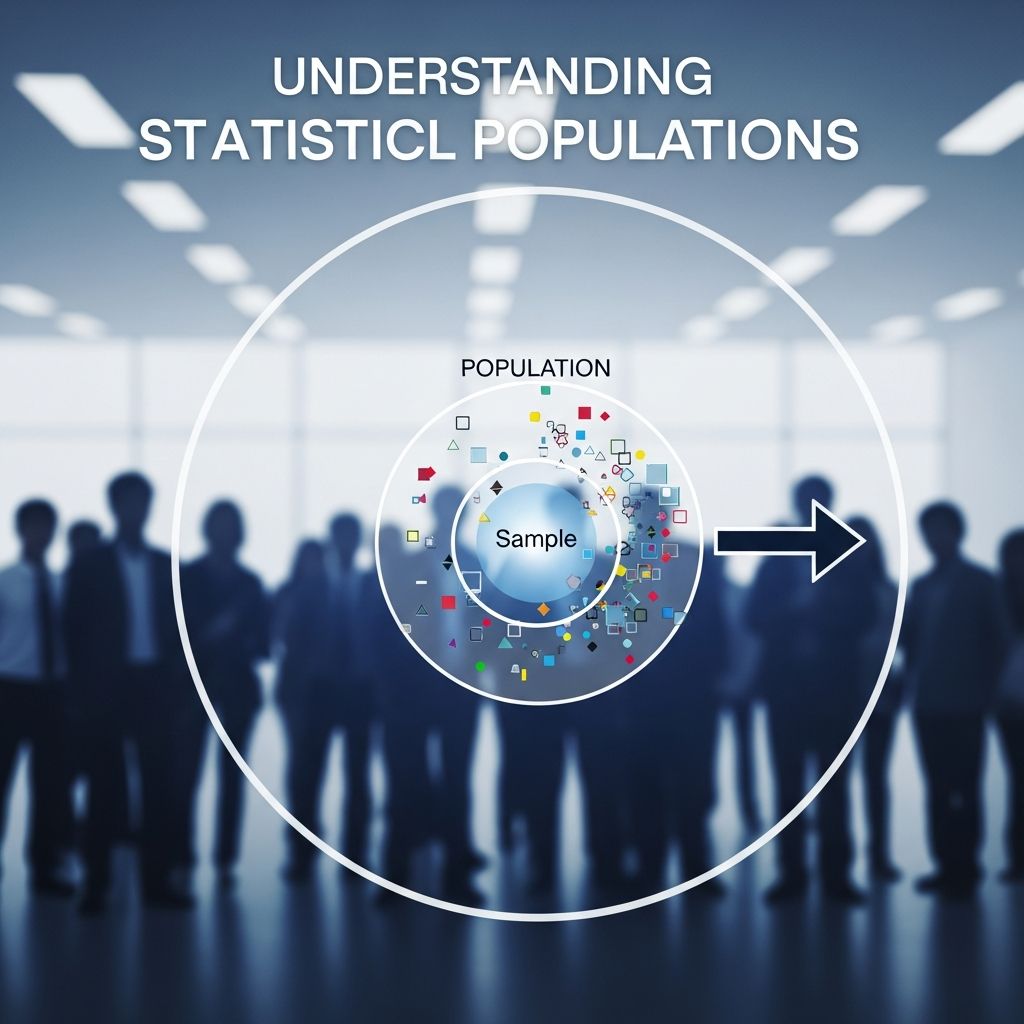
In the realm of statistics, the concept of a population serves as the cornerstone for all analytical processes. It represents the complete collection of entities—be they people, objects, events, or measurements—that share a specific characteristic under investigation. Grasping this idea is crucial for anyone engaging in data-driven decision-making, from researchers to business analysts.
Defining the Statistical Population
A statistical population encompasses every individual unit or item that fits the criteria of the study. This could range from all residents of a nation to every manufactured widget from a factory line. Unlike casual usage where ‘population’ often means human inhabitants, in statistics, it broadly applies to any definable group.
For instance, if a study aims to evaluate customer satisfaction for a new smartphone model, the population might include all global purchasers of that device. This totality allows researchers to draw comprehensive insights, though practical constraints often necessitate studying subsets.
- Populations can be finite, like the 330 million people in the U.S., or infinite, such as all possible outcomes of rolling a die indefinitely.
- They are defined by shared attributes, ensuring relevance to the research question.
- Hypothetical populations, like potential weather patterns, are also valid for theoretical modeling.
Population Versus Sample: Key Distinctions
While a population is the full group of interest, a sample is a selected portion used to infer properties about the larger set. This distinction is vital because directly observing entire populations is frequently impossible due to time, cost, or logistical barriers.
| Aspect | Population | Sample |
|---|---|---|
| Definition | Complete group under study | Subset drawn from population |
| Size Notation | N (often large) | n (smaller) |
| Purpose | True characteristics | Estimate population traits |
| Example | All U.S. voters | 1,000 surveyed voters |
Samples must be representative to yield reliable generalizations. Biased selection, such as polling only urban areas for national opinions, distorts results.
Parameters: Measuring the Population
Characteristics of a population are quantified through parameters, numerical values describing its properties. Common parameters include the population mean (μ), which averages all values, and the population variance (σ²), measuring spread.
These are typically unknown in practice, prompting the use of sample statistics for estimation. For example, the U.S. Census Bureau estimates national unemployment rates from sampled households rather than querying every worker.
- Mean (μ): Central tendency of the entire population.
- Standard Deviation (σ): Average deviation from the mean.
- Proportion (π): Fraction of population with a trait, like disease prevalence.
Parameters provide exact truths, but their computation requires exhaustive data collection, underscoring the value of inferential statistics.
Why Populations Matter in Research
Defining a clear population ensures research questions are answerable and results applicable. Misdefining it leads to irrelevant findings; for example, studying only college students for workforce trends ignores broader demographics.
In fields like epidemiology, populations define at-risk groups for disease tracking. The World Health Organization monitors global populations for vaccine efficacy trials, where the target population is all susceptible individuals.
Businesses use population insights for market segmentation. A retailer analyzing all online shoppers refines targeting strategies, boosting efficiency.
Practical Challenges in Population Studies
Real-world populations pose hurdles like inaccessibility or dynamism. Migrating animal populations or rapidly changing voter rolls complicate complete enumeration.
Solutions involve sampling frames—lists approximating the population—and techniques like stratified sampling to mirror diversity.
In digital eras, big data approximates populations via exhaustive web logs, but sampling remains essential for quality control and cost savings.
Types of Statistical Populations
- Finite Populations: Countable sets, e.g., students in a district. Exact parameters can theoretically be calculated.
- Infinite Populations: Theoretically endless, like random number generations. Relies on probabilistic models.
- Target vs. Accessible Populations: Ideal (target) versus feasible (accessible) groups. Discrepancies require adjustment.
- Real vs. Hypothetical: Observable groups versus conceptualized ones for simulations.
Choosing the right type aligns methodology with objectives, enhancing validity.
From Population to Inference
Statistical inference bridges samples to populations using probability. Confidence intervals estimate parameter ranges, e.g., a poll claiming 52% support with a ±3% margin.
Hypothesis testing evaluates claims, like whether a new drug affects the patient population mean recovery time. Central Limit Theorem ensures sample means approximate population means with large samples.
Errors include sampling bias and non-response, mitigated by random selection and weighting.
Real-World Applications Across Disciplines
In public health, populations guide policy; COVID-19 studies targeted global infected populations for vaccine trials.
Environmental science examines wildlife populations for conservation, sampling species counts.
Economics analyzes consumer populations for inflation impacts via household surveys.
Machine learning trains models on population-like datasets, generalizing predictions.
Advanced Concepts: Finite Population Correction
For finite populations, sampling without replacement affects variance. The finite population correction factor, √[(N-n)/(N-1)], adjusts standard errors.
This is critical in quality control, where inspecting most items from a batch nears full population coverage.
Common Pitfalls and Best Practices
- Avoid undercoverage by ensuring sampling frames are comprehensive.
- Validate representativeness through demographic matching.
- Document population definitions transparently for reproducibility.
- Use software like R or Python for population modeling simulations.
Adhering to these elevates research integrity.
Frequently Asked Questions (FAQs)
What is the difference between a population and a sample in statistics?
A population is the entire group of interest, while a sample is a smaller, selected subset used for analysis due to practicality.
Can a statistical population include non-human elements?
Yes, populations can comprise animals, objects, events, or data points sharing a trait, not just people.
How do you denote population size?
Population size is denoted by uppercase N, contrasting with sample size n.
What is a population parameter?
A parameter is a numerical summary of the population, like mean (μ) or proportion, usually estimated from samples.
Why can’t we always study the entire population?
Constraints like cost, time, and access make full enumeration infeasible for large or infinite groups.
References
- Who and What Is a “Population”? Historical Debates, Current … — PMC/NCBI. 2012-10-29. https://pmc.ncbi.nlm.nih.gov/articles/PMC3530737/
- What is a Population in Statistics? — Statistics How To. 2023-01-15. https://www.statisticshowto.com/what-is-a-population/
- Statistical population – Wikipedia — Wikipedia. 2024-05-20. https://en.wikipedia.org/wiki/Statistical_population
- Population – Australian Bureau of Statistics — Australian Bureau of Statistics (.gov.au). 2023-08-10. https://www.abs.gov.au/statistics/understanding-statistics/statistical-terms-and-concepts/population
- Population vs Sample: Uses and Examples – Statistics By Jim — Statistics By Jim. 2024-02-14. https://statisticsbyjim.com/basics/population-vs-sample/
- Population vs. Sample | Definitions, Differences & Examples — Scribbr. 2024-03-05. https://www.scribbr.com/methodology/population-vs-sample/
- Population vs Sample in Statistics – GeeksforGeeks — GeeksforGeeks. 2024-04-01. https://www.geeksforgeeks.org/machine-learning/population-and-sample-statistics/

Medha Deb is an editor with a master's degree in Applied Linguistics from the University of Hyderabad. She believes that her qualification has helped her develop a deep understanding of language and its application in various contexts. Medha specializes in the areas of beauty, health, sports, and wellness and is committed to ensuring that the content on the website is…