
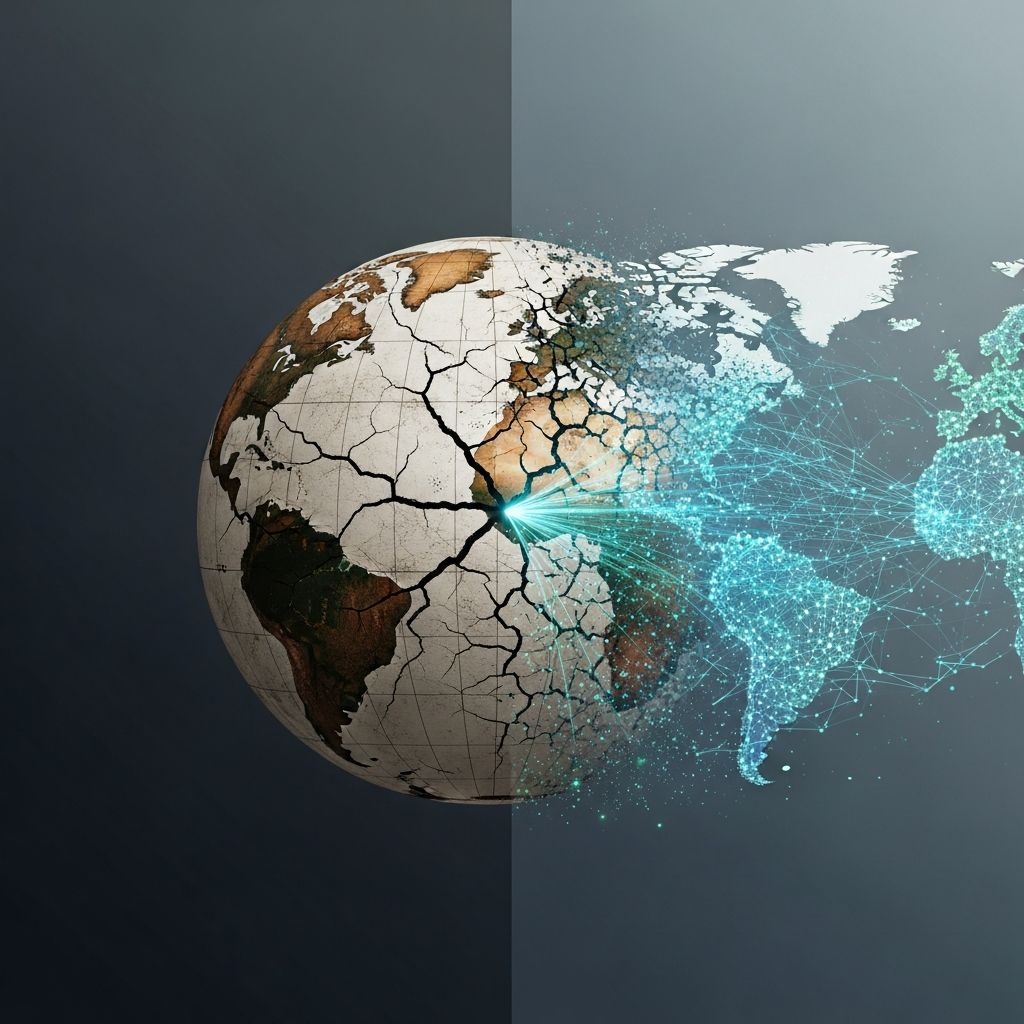
Public debate about the state of the world is often driven by headlines, anecdotes, and our immediate surroundings. Long-run, global data rarely makes the front page, yet it radically changes what we believe about humanity’s past, present, and future. This is the central insight behind Our World in Data, the open research project founded by economist and social historian Max Roser at the University of Oxford.
This article explores how long-run data reshapes our views on progress and risk, why open access to evidence matters, and what it implies for anyone who wants to make a difference in the world.
The Idea Behind Our World in Data
Our World in Data (OWID) is a scientific online publication that brings together data on the world’s largest problems—such as poverty, disease, hunger, war, and climate change—and makes them freely available and understandable. It is run by the non-profit Global Change Data Lab in collaboration with researchers at the University of Oxford.
- Mission: Publish research and data that help people make progress against the world’s biggest challenges.
- Scope: Topics range from health, education, and economic growth to energy, climate, technological change, and existential risks.
- Audience: Policymakers, researchers, journalists, educators, and anyone seeking an evidence-based view of global development.
The core conviction is simple but powerful: to understand how the world is changing, we need to look at carefully collected, long-run statistics, not just recent events.
Why Our Intuition About Global Progress Is Often Wrong
Surveys in high-income countries consistently show that most people believe the world is getting worse, especially regarding poverty, violence, and health. Yet historical data suggests a different story: over the last two centuries, global living conditions have improved dramatically, even as serious problems remain.
Examples of Misaligned Perceptions
- Many people think extreme poverty is rising, when in fact its global share has fallen from the majority of humanity in 1820 to a small minority today.
- Violent deaths from interstate wars are far below their peaks in the first half of the 20th century, even though conflicts still cause immense suffering.
- Child mortality has declined from roughly half of children dying before age five in the past to around 4% today, thanks to better nutrition, vaccines, and health systems.
Our World in Data emphasizes that two things can be true at once:
- The world has made extraordinary progress across many dimensions of well-being.
- The world still faces enormous, morally urgent problems that require sustained effort.
Seeing both truths clearly matters. It replaces despair with informed urgency: we know improvement is possible because it has already happened, and we have evidence about what helped.
Key Domains Where Long-Run Data Changes the Story
Our World in Data covers dozens of topics. Several stand out as particularly important for understanding global progress and risk.
1. Poverty and Economic Growth
Historical estimates of income and consumption show that extreme poverty was the default condition for most humans throughout history. Rapid economic growth, particularly since the Industrial Revolution, enabled a large share of the world’s population to escape this state.
- In the last three decades, the reduction in extreme poverty has been faster than at any other time in recorded history.
- However, hundreds of millions still live on very low incomes, and future progress is not guaranteed without growth in the poorest economies.
OWID’s work allows readers to compare poverty not only between countries, but across time, and to ask what levels of income we should consider acceptable in the future, not merely “less bad” than the past.
2. Health, Disease, and Global Burden
Long-run data on life expectancy, child mortality, infectious diseases, and health systems reveals an extraordinary transformation. Improvements in vaccines, antibiotics, basic sanitation, and health financing have led to large increases in average life expectancy worldwide.
Our World in Data’s health entries draw on major public datasets from organizations such as the World Health Organization and the World Bank to show:
- Declines in mortality from many infectious diseases over time.
- The shifting burden from communicable to non-communicable diseases as countries get richer.
- Persistent inequalities in health outcomes between and within countries.
These visualizations help users see health not as a static snapshot, but as a dynamic process shaped by public policy, technology, and global cooperation.
3. Data on COVID-19 as a Case Study
During the COVID-19 pandemic, Our World in Data became a central hub for global statistics on testing, vaccination, and excess mortality. Their datasets were widely used by the World Health Organization, the United Nations, national governments, academic researchers, and major media outlets.
This episode illustrates several broader lessons:
- Timely, open data can guide public health responses and inform citizens.
- Common standards across countries make comparisons and learning possible.
- Independent, non-profit data infrastructure can complement official statistical agencies.
4. Energy, Climate, and Environmental Change
Our World in Data also synthesizes data on energy systems, greenhouse gas emissions, and environmental trends. These topics are crucial for understanding climate change and the scale of the transition required.
In 2021, OWID began publicly advocating for the International Energy Agency (IEA) to release more of its energy data freely, arguing that paywalled or restricted datasets slow progress on climate and energy analysis. This advocacy reflects a consistent theme: open data is not just a technical preference; it is a condition for effective global problem-solving.
5. Population, Technology, and the Future
Roser and his colleagues use long-run statistics on population growth, technological change, and economic productivity to help readers think about the future. For instance:
- Population growth is now slowing, and projections suggest the world may reach a long-run equilibrium later this century.
- Technologies like computing and renewable energy often follow predictable patterns of cost decline as cumulative production increases, sometimes described by Wright’s Law.
- These trends shape what is feasible in climate mitigation, health innovation, and global development.
Our World in Data also covers risks from advanced technologies, including AI, emphasizing that decisions by a small group of technologists can have far-reaching consequences.
From Spreadsheets to Global Infrastructure
Our World in Data started as a personal side project. Roser initially assembled datasets for his own research and teaching, then gradually turned them into public visualizations. Over roughly a decade, the project scaled from a one-person effort to a widely used global resource that now reaches tens of millions of users annually.
| Aspect | Early Days | Today |
|---|---|---|
| Team | Essentially a single researcher (Max Roser) | Dedicated research and engineering team at Oxford and Global Change Data Lab |
| Scope | Selected topics on living conditions | Dozens of domains including health, climate, technology, conflict, and risks |
| Users | Primarily students and a small academic audience | Policy makers, international organizations, media, researchers, and the general public |
| Impact | Teaching and small-scale outreach | Cited tens of thousands of times per year; used by WHO, UN, and governments. |
This trajectory highlights how rigorous, clearly explained data—made freely available—can evolve into critical infrastructure for understanding global challenges.
Principles That Make the Project Work
Several design principles underpin Our World in Data’s influence and trustworthiness.
1. Radical Transparency
- Data sources are clearly documented, usually drawing on official statistics from organizations such as the World Bank, WHO, and national statistical offices.
- Code and datasets are openly accessible, enabling others to replicate or extend the work.
- Uncertainties and limitations of data are discussed, not hidden.
2. Long-Run, Global Perspective
- Charts typically span decades or centuries, not just a few years.
- Data covers as many countries as possible, including low-income states often underrepresented in public debate.
This approach helps avoid misleading conclusions drawn from noisy short-term fluctuations or narrow country samples.
3. Accessible Communication
- Visualizations are interactive and designed for clarity, not for statistical specialists only.
- Each chart is accompanied by explanatory text that provides context, definitions, and caveats.
- Free licensing allows educators and journalists to reuse charts widely with attribution.
4. Focus on Action-Relevant Questions
Rather than collecting data for its own sake, Our World in Data focuses on questions that affect major moral and policy decisions, such as:
- How quickly is extreme poverty declining, and where are people left behind?
- Which causes of death account for most of the global disease burden?
- What energy pathways are compatible with climate goals?
- How are fertility and population trends shaping future demographics?
This focus makes the platform particularly useful for people interested in effective altruism, global development, and evidence-based policy.
Why Open Data Matters for Solving Global Problems
Roser and his team argue that the world is not short of knowledge about how to reduce suffering; rather, it fails to deploy that knowledge effectively. A major reason is that crucial data is often locked away in inaccessible databases or behind paywalls.
Open, well-documented datasets can:
- Enable more researchers to investigate pressing problems.
- Allow journalists and educators to communicate evidence to wider audiences.
- Support accountability by letting citizens scrutinize trends and policies.
- Reduce duplication, as organizations reuse and adapt existing data infrastructure.
In this sense, Our World in Data functions not only as a publication, but as a public good: a shared resource that others can build upon.
How Individuals and Institutions Use Our World in Data
Because OWID combines open data, documented methods, and clear charts, it serves a wide variety of use cases.
- Teachers and students: Use charts to explain concepts like exponential growth, health transitions, or inequality.
- Journalists: Incorporate visualizations to provide context and counter misconceptions in stories on global issues.
- Policymakers: Compare their country’s performance in areas such as vaccination, emissions, or education to peers and historical benchmarks.
- Researchers: Start from curated datasets, then drill down into original sources for more technical analysis.
The platform’s license and documentation are deliberately designed to support this kind of reuse.
How Long-Run Data Can Guide Personal and Career Choices
For people considering how to have a positive impact on the world—whether through philanthropy, careers, or public advocacy—Our World in Data offers several benefits:
- Clarifying priorities: Data on the scale of problems (for example, total disease burden or number of people in extreme poverty) helps compare causes.
- Tracking progress: Long-run time series reveal which areas are neglected or stalled, and which are improving rapidly.
- Understanding interventions: Historical case studies show how policy, technology, and innovation have changed outcomes.
- Reducing bias: Evidence helps guard against focusing only on problems that are vivid, local, or recently in the news.
Roser’s broader work argues that understanding progress is not about complacency; it is about learning what has worked and how we can do more of it.
Frequently Asked Questions (FAQs)
Q1: What is Our World in Data and who runs it?
Our World in Data is a scientific online publication that compiles and visualizes data on major global problems like poverty, disease, climate change, and inequality. It is produced by the non-profit Global Change Data Lab and a research team based in Oxford, founded and led by Max Roser.
Q2: Is the data on Our World in Data reliable?
OWID primarily uses data from reputable sources such as the World Bank, World Health Organization, UN agencies, and national statistical offices, and it provides clear documentation and discussion of data limitations. This transparency allows users to assess reliability and trace numbers back to their origin.
Q3: How did Our World in Data contribute during the COVID-19 pandemic?
During COVID-19, OWID built global datasets on testing, vaccination, and related metrics that were used by the WHO, UN, national governments, and many researchers and news organizations. Their open, regularly updated data became a key reference for tracking the pandemic.
Q4: Do I need to pay or register to use the charts and data?
No. Our World in Data is free to use, and its data and visualizations are openly available under permissive licenses that allow reuse with proper attribution. This makes it easy for educators, journalists, and researchers to incorporate the material into their own work.
Q5: How can I start using Our World in Data for my own projects?
You can browse topic pages such as health, energy, or inequality on the OWID website, download datasets in standard formats, and embed interactive charts in your own pages with attribution. Many users begin by exploring a topic relevant to their research, teaching, or policy question and then follow the links to underlying data sources.
References
- Our World in Data: Visualising the empirical evidence on how the world is changing — Oxford Martin School. 2015-06-01. https://www.oxfordmartin.ox.ac.uk/publications/our-world-in-data-visualising-the-empirical-evidence-on-how-the-world-is-changing/
- Our World in Data — Global Change Data Lab & University of Oxford. Last updated 2024. https://ourworldindata.org
- About — Our World in Data — Global Change Data Lab. 2023-10-01. https://ourworldindata.org/about
- Max Roser — Our World in Data / University of Oxford. 2025-11-17. https://ourworldindata.org/team/max-roser
- Our World in Data — Harvard Global Health Education and Learning Incubator (GHELI) Repository. 2019-01-15. https://repository.gheli.harvard.edu/repository/12126/
- Our World in Data: Transforming data into global impact — University of Oxford, Social Sciences Division (YouTube transcript). 2025-01-20. https://www.youtube.com/watch?v=RCz6EIcSFQ8
- Watch our founder, Max Roser, share the story of Our World in Data — Our World in Data. 2021-09-15. https://ourworldindata.org/watch-max-roser-share-our-world-in-data-story

- Integrated M.A. in Applied Linguistics, University of Hyderabad
- 5+ years in editorial, instructional, SEO, and research-based writing
Sneha is a relationships and lifestyle writer with a strong foundation in applied linguistics and certified training in relationship coaching. She brings over five years of writing experience to theskillvault, crafting thoughtful, research-driven content that empowers readers to build healthier relationships, boost emotional well-being, and embrace holistic living. Her writing and insights reflect the belief that beauty, happiness, and wellness…